ArcGIS Blog

Mapping

ArcGIS Pro

Transform Dynamically Aggregated Time Series Results into Polygons in ArcGIS

By Tanu Hoque

This is a continuation of another blog post where I described how to compute aggregated results such as totals and averages from a time series table and show them at the point locations where those values were measured. These results are helpful in many analyses. But there are cases where it is required to visualize them using polygon features. For example, if you are an emergency management professional, you may want to know which counties have the most rainfall; whereas if you’re a scientist, you may want to see the same result but aggregated into watershed boundaries/catchment areas instead.

Weighted total rainfall computed for each county from rainfall stations

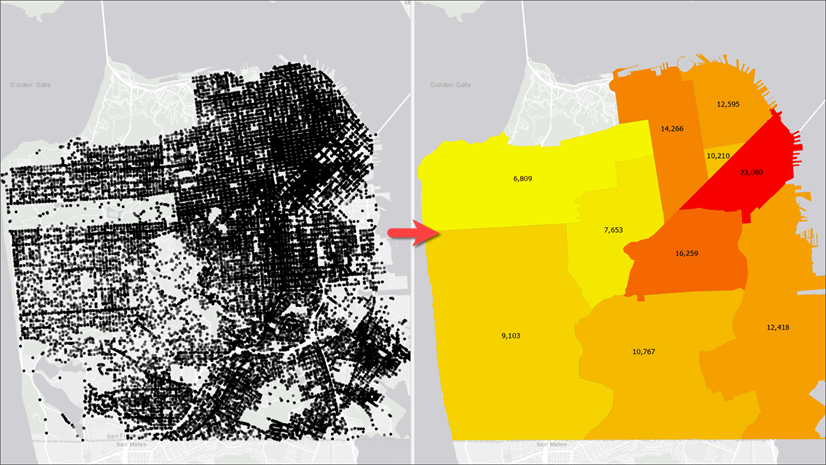
When it comes to transforming results from points to polygons, naturally we think of a simple spatial operation—such as a Contains or a Within operation—to (a) find all points that fall within a polygon feature and (b) use those features to compute the result. This simple approach works well with discrete data, such as computing total sales from all point locations at the state or county level. But this does not work for analyses with sampled data such as rainfall measurements. If you were to do that, you’d get a map, like the one below, where counties with no rainfall stations are not even drawn on the map — basically the map says there were no rain in those counties! That is not true, right?

Simple spatial operation produces incorrect map with missing counties

To avoid that problem and produce an accurate map, we will use Thiessen polygons to compute the rainfall distribution in our area of interest. Such result can be achievable by executing some geoprocessing tools, but that produces result only for one time slice. Every time you want to see result for a different time slice, you need to rerun those tool. This blog post provides step-by-step instructions that overcomes geoprocessing tools limitations – makes the result map reactive to time slider’s current time and still computes aggregated results, such as total rainfall dynamically from a time series table.

Prepare the Data

Let’s get started:

  • Download an ArcGIS Pro package to get started with sample data.
  • Double-click on the package file you downloaded to open in ArcGIS Pro.
    The Rainfall Data map contains a table and a couple of layers:

    • The two intermediate layers, found in a group layer, are the results of overlay operation between (a) Thiessen polygons (from point features representing rainfall stations) and county boundaries, and (b) Thiessen polygons and watershed boundaries.
  • Create a new database connection to your enterprise database.
  • Go to the Catalog pane, then navigate to Databases\Rainfall_IL.gdb.
  • Copy all feature class and tables from the file geodatabase to your enterprise database.

Visualize Weighted Total Rainfall at the County Level

Next, we’ll add a query layer:

  • Click the Query Layer option from the Add Data command on the Map tab.
  • Select your database connection.
  • Give it a name such as Weighted Total Rainfall by County.
  • Copy the following query and paste it in the Query text box:
    SELECT c.objectid, c.Name, c.shape, c.POP2010, fo.Rainfall AS Weighted_Total_Rainfall
    FROM COUNTIES_IL c
    INNER JOIN
    (
    SELECT t.fips, (sum(r.rainfall_inch * t.area) / sum(t.area)) AS rainfall
    FROM COUNTIES_THSN_INTSCT_IL t
    INNER JOIN
    (
    SELECT site_no, Sum(rainfall_inch) AS rainfall_inch
    FROM USGS_RAINFALL_TIMESERIES_IL
    WHERE ::r:dateRange
    GROUP BY site_no
    ) r
    ON r.site_no = t.site_no
    GROUP BY t.FIPS
    ) fo
    ON c.fips = fo.fips
  • Click the blue pencil icon next to the ::r:dateRange parameter to bring up an inline editor to define the parameter.
Edit Query Layer dialog with a range parameter
  • Fill in all necessary information as seen in the following screenshot.
    1. Field or Expression—Type “date_time”.
    2. Data Type —Choose Date.
    3. Default value—Uncheck the check box.
    4. Name of the table the field belongs to—Type “USGS_RAINFALL_TIMESERIES_IL”.
Definition a range parameter
Defining a range parameter
  • Click Done.
  • Click the Validate button.
  • Click the Next button if there is no error.
    On the next page, Unique Identifier Field(s), Geometry Type, and Spatial Reference should get determined automatically.
  • Click Finish.
    A query layer gets added to the map.
  • Symbolize the layer with unclassed symbology using the Weighted_Total_Rainfall attribute.
    Since a range parameter is used in the query layer’s source SQL, the layer is automatically made time aware.
    The Time Slider appears on the map.
  • Enable the time slider from the Time tab.
  • Set the time span to 1 month.
    Counties with computed rainfall for that month will appear.
  • Use the time slider to go to a different month, or change the time settings to view the aggregated result by week or for any other time duration.
Map on the left showing total rainfall at point locations. Map on the right shows same result transformed to county boundaries

Visualize Weighted Total Rainfall for Watersheds

If you want to visualize the weighted total rainfall for watersheds instead of county boundaries, all you need to do is to repeat steps from the previous section but with a watershed layer. Let’s create another query layer with the following SQL query:

SELECT w.objectid, w.huc8, w.Shape, rh.rainfall_w AS Weighted_Total_Rainfall
FROM USGS_HUC8_WATERSHEDS_IL w
INNER JOIN
(
SELECT huc8, (sum(r.rainfall_inch * c.areasqkm) / sum(c.areasqkm)) as rainfall_w
FROM USGS_HUC8_thsn_intsct_il c
INNER JOIN
(
SELECT site_no, Sum(rainfall_inch) AS rainfall_inch
FROM USGS_RAINFALL_TIMESERIES_IL
WHERE ::r:dateRange
GROUP BY site_no
) AS r
ON r.site_no = c.site_no
GROUP BY c.huc8
) AS rh
ON w.huc8 = rh.huc8

Map on the left showing total rainfall at point locations. Map on the right shows same result transformed to watershed boundaries

Share and Consume Data in Web Maps

You can share the map as a map image layer (or map service).

  • Consume the service on a web application such as ArcGIS Online or a portal map viewer or a Web AppBuilder for ArcGIS application.
  • Use the time slider to see the same results.

Share this article

Subscribe
Notify of
2 Comments
Oldest
Newest
Inline Feedbacks
View all comments
Carissa Choong(@cchoongsidwell)
November 9, 2021 11:08 am

This script is going to be such a huge help but I am running into an error when I run the script as coped: it says that: name “GetParameter” is not defined. Is it because I am running ArcGIS Pro 2.4 perhaps? Thanks!

Katarina Hirai(@khiraisl)
November 18, 2021 11:56 am

Anyone try this? I can’t get the Time Zone to set correctly. After publishing, the feature service reflects UTC for our data’s date fields even though I set the “timezone” parameter to “Pacific Standard Time”.

Yuguang Liu(@yuguangl_uom)
January 23, 2022 7:55 pm

Hi there,

I have created the publish web feature layer, but the input is “map”. What I want to select and publish is a “layer” in the content pane. Could you please tell me how to solve the problem? Thanks in advance.

Best
Leo

James Shreeve(@jshreevesnorfolk)
January 31, 2022 6:08 am
Reply to  Jonah Lay

Hi Jonah, you sent me to this blog from another post last week (thank you!) and I’ve been working through the above and have come across the same problem as Leo. I’ve had a look at the code sample you supplied, is there a way to create a script tool using that code or does it need to be run as a standalone Python script? Or is there a way to alter the code for this blog to look at features rather than map files? Many thanks in advance

Robert Thomson(@miramichiadministrator)
January 24, 2022 12:22 pm

This is great but I can only get it to work if I leave share_groups blank or just use one group name. Otherwise I get 0x800 “This value is not a member of” Any ideas? I’m separating group names with commas. I’m running ArcGIS Pro 2.9.

Robert Thomson(@miramichiadministrator)
January 25, 2022 8:42 am
Reply to  Jonah Lay

That was all I needed, thanks.

Nicholas Gray(@graynic)
February 10, 2022 1:46 pm

Thank you very much for posting this! Is there a way to set the Portal connection where the data will publish to? It looks like it defaults to whatever Portal you are/were signed in to last. I have several Portal/ArcGIS Online connections in Pro but would like to specify which one it publishes too. I plan on setting this up as a scheduled task so I need to make sure it publishes to the right Portal. Thank you!

jonathan molineaux(@jonathan-molineaux_noaa)
February 24, 2022 5:13 am

Thank you for posting this article. I am having an issue with seeing my Portal connection in the output folder though. Is there a workaround for this? If I add the SignInToPortal ArcPy function, will this allow me to view the Portal Connection in my output folder?

Last edited 3 years ago by jonathan molineaux
Evan Marshall(@evan-marshallci-stpaul-mn-us_stpaul)
April 1, 2022 8:02 am

Hello, I implemented this script tool and generally it works well. We do have a weird issue where if we try to use it to overwrite an existing hosted table, it works, but converts the item to a hosted feature layer. We need these items to persist in AGO as hosted tables. Any thought to adding a parameter to tell it to overwrite as a table rather than a service? or choose no geometry type? thanks!

Wilson, Jared(@jcwilson4_ncdenr)
April 8, 2022 11:24 am

I’ve downloaded and used the model as it is used in the demonstration map and it uploaded the layer directly to my AGOL content pane, however, when I attempt to run the Publish Web Feature Layer in my own map, the tool runs for a very extended period of time seemingly without end. Is there an option I should be selecting that is different? I selected to run the tool exactly how I had it in the demo as well.

steve miller(@suasteve)
April 26, 2022 7:35 am

I’ve downloaded the script and got the Model working with one exception, I have a date field and I can’t get it to publish in Eastern Time Zone. What should I be putting in the Time zone parameter? I’ve tried EDT and Eastern_Daylight_Time, but the date field in the web layer is showing UTC. As a side note, when I query the AGOL rest the date field is in EDT.

Thank
Steve

Julia Hillin(@jhillin)
June 24, 2022 11:40 am

I’ve tried running this script but I get a traceback error to lines 30, 68, and 122 and a ValueError: Missing target server. I copied the script over directly and used the correct inputs/configurations, so I’m not sure what the issue is. Any ideas?

Last edited 3 years ago by Julia Hillin
Michael Olkin(@swscgisadmin)
November 2, 2022 9:45 am

I have successfully run this script within a model in a project, but I have not yet had success running it as a scheduled task. Here’s the error that I see in the log after attempting to run it as a scheduled task:

<msg code=”100″ type=”-2147467259″>Failed to execute. Parameters are not valid.</msg><msg code=”100″ type=”735″>The value is empty. ERROR 000735: Map: Value is required</msg>

I have checked and re-checked the script and parameters, but all appears to be set up correctly.

Nicholas Gray(@graynic)
December 13, 2024 9:41 am
Reply to  Michael Olkin

@Michael Olkin did you ever fix this issue? I am experiencing the same thing. I can run the model fine and it publishes but when I schedule it I get this same error. @Jonah Lay Thank you!

Amin Alhassan(@amin-alhassanloudoun-gov_loudounps)
August 9, 2023 10:18 am

Hello Jonah,
Thanks for sharing this script, it’s still “golding” to me. I have adapted it and tried to set the time zone to Eastern Standard Time or ET,EST and all the ways I can imagine the eastern standard time; yet, the time aware data after publishing still shows UTC time values. I have read others comments on the same issue. Are you able to look into that or any other work around. I really appreciate the effort put in.

Thanks,
Amin

Amin Alhassan(@amin-alhassanloudoun-gov_loudounps)
August 15, 2023 10:36 am
Reply to  Jonah Lay

Thanks Jonah, it worked at last. Any thought on overwriting a stand alone hosted feature layer in AGOL? This did not set the time zone but the feature was overwritten when I tried on a hosted feature layer not in a web map.

Carlos Alberto Duarte Carranza(@caduarte_vrip)
September 25, 2023 11:46 am

Dear Jonah,
Thanks for this great and absolutely useful tutorial!
I have a model which ends with a feature layer as output. How can I connect my model with the model in your tutorial to publish (only) my output feature to AGOL?

Thanks in advance!

Carlos

Andrew Ferguson(@andrew-ferguson_whg)
October 9, 2023 3:31 am

Dear Jonah, Thank you. This is an excellent article. I’m having some difficulty publishing a single feature via a model I’ve created. I’ve modified the code to select my layer with “selected_layer = m.listLayers()[0]” and provided this variable within a list as a parameter in the m.getWebLayerSharingDraft() function however I am getting the error: Error 001272: Analzer errors were encountered ([{"code":"00102", "message":"Selected layer does not contain a required layer type for web feature layer", "object":"Map"}]). I can manually publish the layer to AGOL without any analyser errors though. Can you offer any insight as to why this is happening? Thanks… Read more »

Adam Hart(@ahart_midlandcounty)
July 3, 2024 11:25 am

Jonah,

This is a great tool and I am hoping to use it with some of our data. I have one question…How would the code be modified to overwrite a layer with attachments? The steps in the model work fine to add the attachments to the feature class, but I’m having trouble trying to overwrite the AGO layer with the updated attachments. Any help would be greatly appreciated. Thanks