We are pleased to share the exciting news that next month (June 2018), Esri will be releasing our latest ArcGIS solution for crime and intel analysts! This release is the culmination of years of effort and was done with the assistance of too many folks to be named here, including many practitioners from the extended analyst community around the world.
The solution, which we are calling Crime Analysis (though the tools in it will have applicability well beyond crime analysis), will be an add-in for ArcGIS Pro and will be free to those who are current on their ArcGIS maintenance.
ArcGIS Pro
Before we go any further into the description of the solution and what it does, let’s take a minute to talk about ArcGIS Pro. If you haven’t yet familiarized yourself with ArcGIS Pro, it is the next generation of desktop GIS from Esri. ArcGIS Pro is not a web-based GIS (though it enables easy collaboration via web maps and apps). It is part of ArcGIS Desktop, and any users who are current on maintenance for ArcMap can install ArcGIS Pro for free. It is probably also important to say that ArcGIS Pro can be installed on your machine without affecting your current ArcMap license—you can run them independently of each other. ArcMap will continue to be supported for a long time, but all future development from Esri will focus on new functionality and tools in ArcGIS Pro.
Why ArcGIS Pro? First, it is much more responsive and easier to use than ArcMap. ArcGIS Pro is a 64-bit application, which lets you render and process data much faster. It features a Microsoft-style ribbon interface, so if you use Office, ArcGIS Pro will immediately look familiar to you. Also, it can accept your existing ArcMap documents (.mxd) and convert them into ArcGIS Pro projects (.aprx). Projects are not backwards compatible, but the data used by ArcGIS Pro can still be accessed in ArcMap for collaboration.
Other new features in ArcGIS Pro include the ability to work with multiple views and layouts open in the same session, the ability to design and edit in both 2D and 3D, and the introduction of tasks. Tasks are important because they give you the ability to create a set of preconfigured steps that will guide you and others through an analytical workflow. Tasks are a key component of the new solution as well as future development of analytical tools by not only us at Esri but also you, the Esri user community. With ArcGIS Pro tasks, you will be able to document, repeat, and share GIS best practices with the rest of the analyst community.
The New Solution
The new solution will support many of the most common workflows currently performed by analysts with ArcMap and include some all-new tools for out-of-the-box capabilities previously not provided in ArcGIS. The tools will be organized into a single ribbon interface and distinct buckets that support the following:
- Data management
- Data selection
- Tactical and strategic analysis
- Investigative analysis
- Creation and sharing of finished information products
Now let’s take a closer look at each of the supported workflows and the associated tools that are in each.
Data Management
The data management tools will give you several options for importing data into ArcGIS, cleaning that data, and then enhancing and enriching it to enable further analysis.
Add Data allows you to import data from an existing geodatabase, a shapefile, or a .csv file.
XY Table To Point creates a new feature class based on x,y coordinates in a table for easy geocoding of spreadsheets of latitude-longitude data.
Geocode Addresses creates a feature class from a table of address data. It can use the Esri World Geocoding Service or your own address locator.
Setup Import tools prepare a spreadsheet of x,y or address data for the Import Incidents tools. These can be used to configure any dataset that has latitude-longitude or address data (incidents, calls for service, offender data, etc.):
Setup Import From XY Table —Builds a configuration file from x,y data containing the values required by the Import Incidents tool
Setup Import From Address Table—Builds a configuration file from address data containing the values required by the Import Incidents tool
Import Incidents imports the configured incidents from the Setup Import tool into a feature class with assigned geometry using geocoding or coordinate values that can be published using ArcGIS Online or ArcGIS for Server.
Enhance Attributes help prepare and enable your data for analytic workflows such as temporal analysis and by giving your data additional context with tools that define location and enrich the data with demographics and other variables.
Convert Time Field can be used to convert time values stored in string, numeric, or data fields into a format that can be used to enable selection by time of day, day of the week, and so forth.
Convert Coordinate Notation converts coordinates from one format to another.
Extract Date Parts to Field creates new fields containing date related information (hour, month, year, etc.) from a user-defined data field that will enable selection by date.
Append Attributes From Polygon appends fields from a polygon layer to the point layer features within that polygon. For example, this could be used to rename the polygon to include police beat or another descriptor and then add the name of the beat polygon in which each crime occurred within a jurisdiction.
Enrich Layer enriches your data by adding demographic and landscape facts about the people and places that surround or are inside your data locations. The output is a duplicate of your input but includes new attribute fields added to the table. This tool will require an ArcGIS Online organizational account and will consume credits.
Data Selection
As the name implies, these tools are all about selecting data by attributes, location, and date and time. This is where the enhancement and enrichment that you have done with the data management tools will pay dividends.
The Select tool selects features by drawing a rectangle, polygon, lasso, circle, line, or tracing of other features on the map.
Select By Attributes allows you to select feature by their attribute values.
Select By Location selects features using the location of features in another layer.
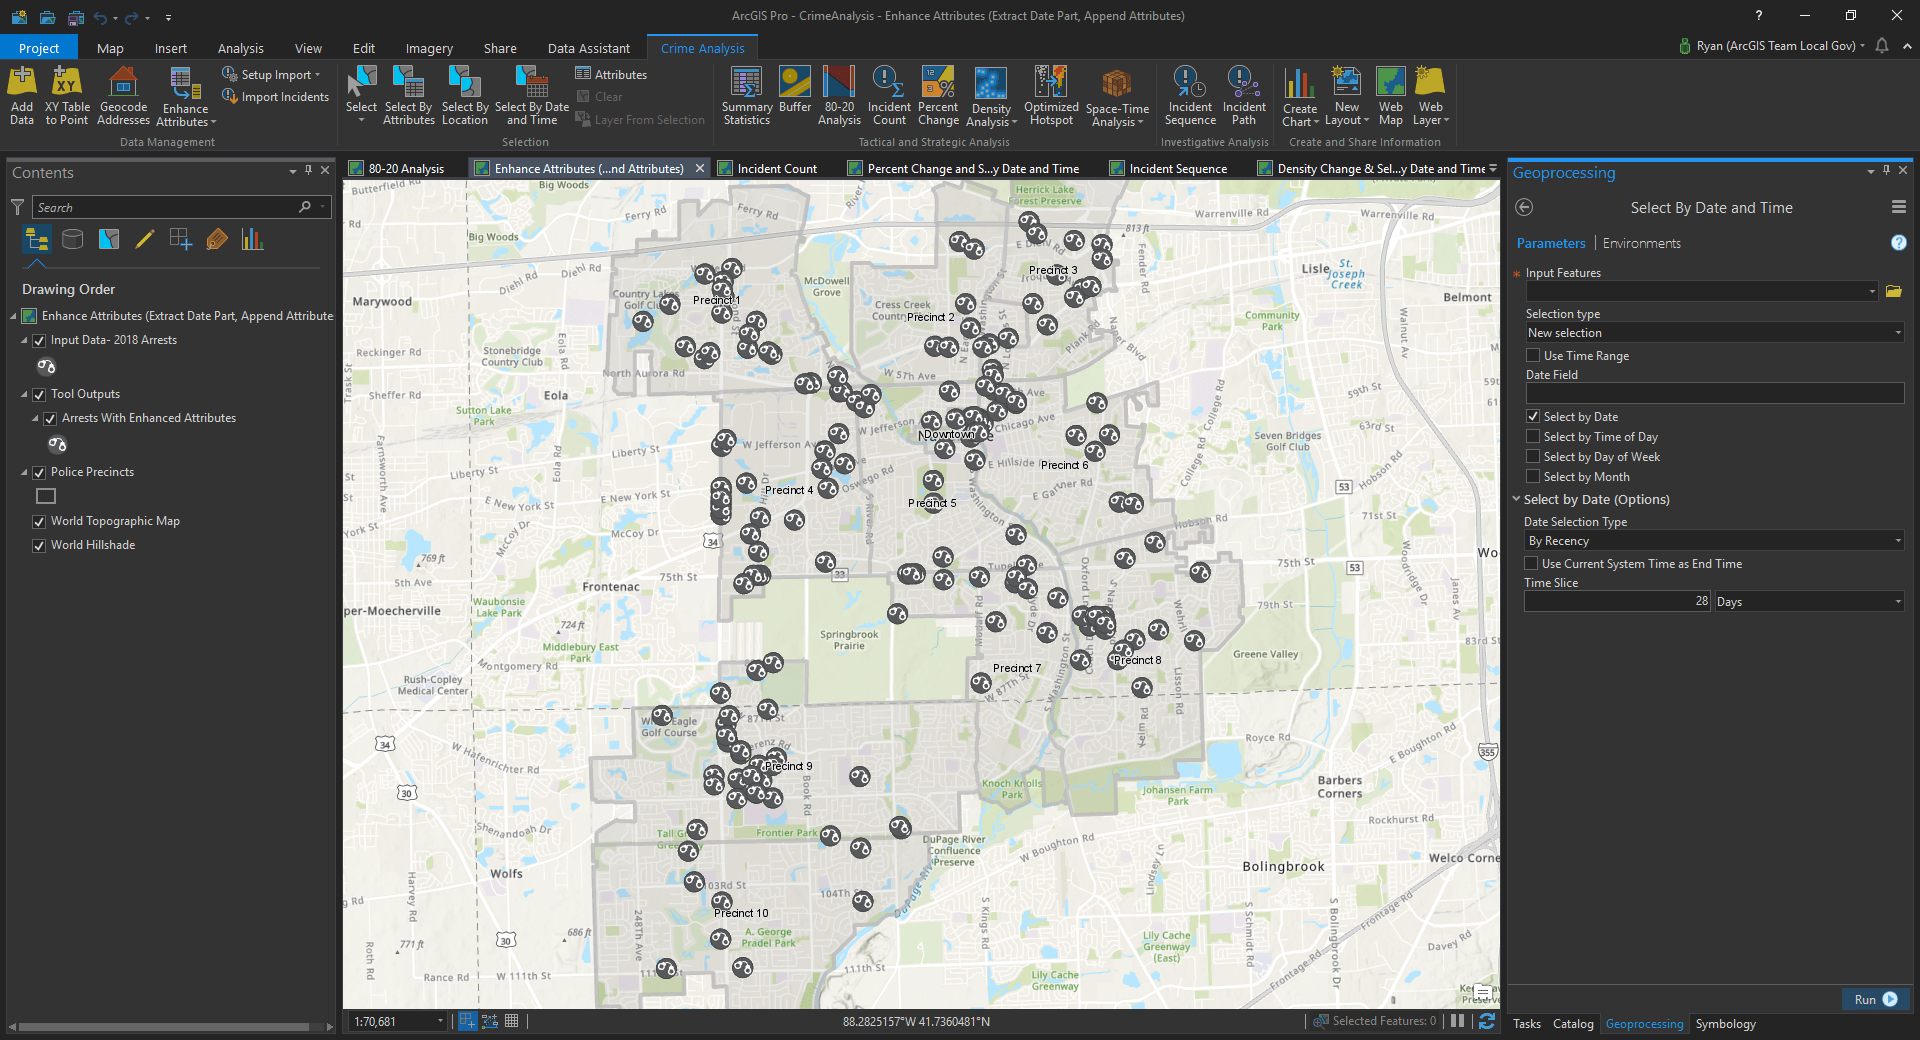
Select By Date and Time selects features based on date and time ranges (the last 14 days, 30 days, etc.) or by parts (only weekdays, within 2,000–2,200 hours, etc.). This tool requires the date and time values to be in a date field format.
Tactical and Strategic Analysis
These tools focus on tactical and strategic crime analysis. They feature several of the GIS functions most commonly used by the analyst and include a couple of new tools that have been long asked for by the community.
Summary Statistics supports the basic statistical functions of getting a count of incidents by reading a table and a set of fields and by creating a new table containing unique field values and the number of occurrences of each unique field value (by beat, etc.).
Buffer can create multiple buffers at user-defined distances around selected input features.
80-20 Analysis creates a graduated symbol layer for points with multiple incidents at the same location. It supports analysis based on the 80/20 rule (also known as the Pareto Principle), that a small number of locations are responsible for a large proportion of an agency’s calls for service. This tool also calculates a cumulative percentage of incidents at these problem locations.
Incident Count creates a polygon or polyline choropleth layer with a corresponding count of incidents within the defined area
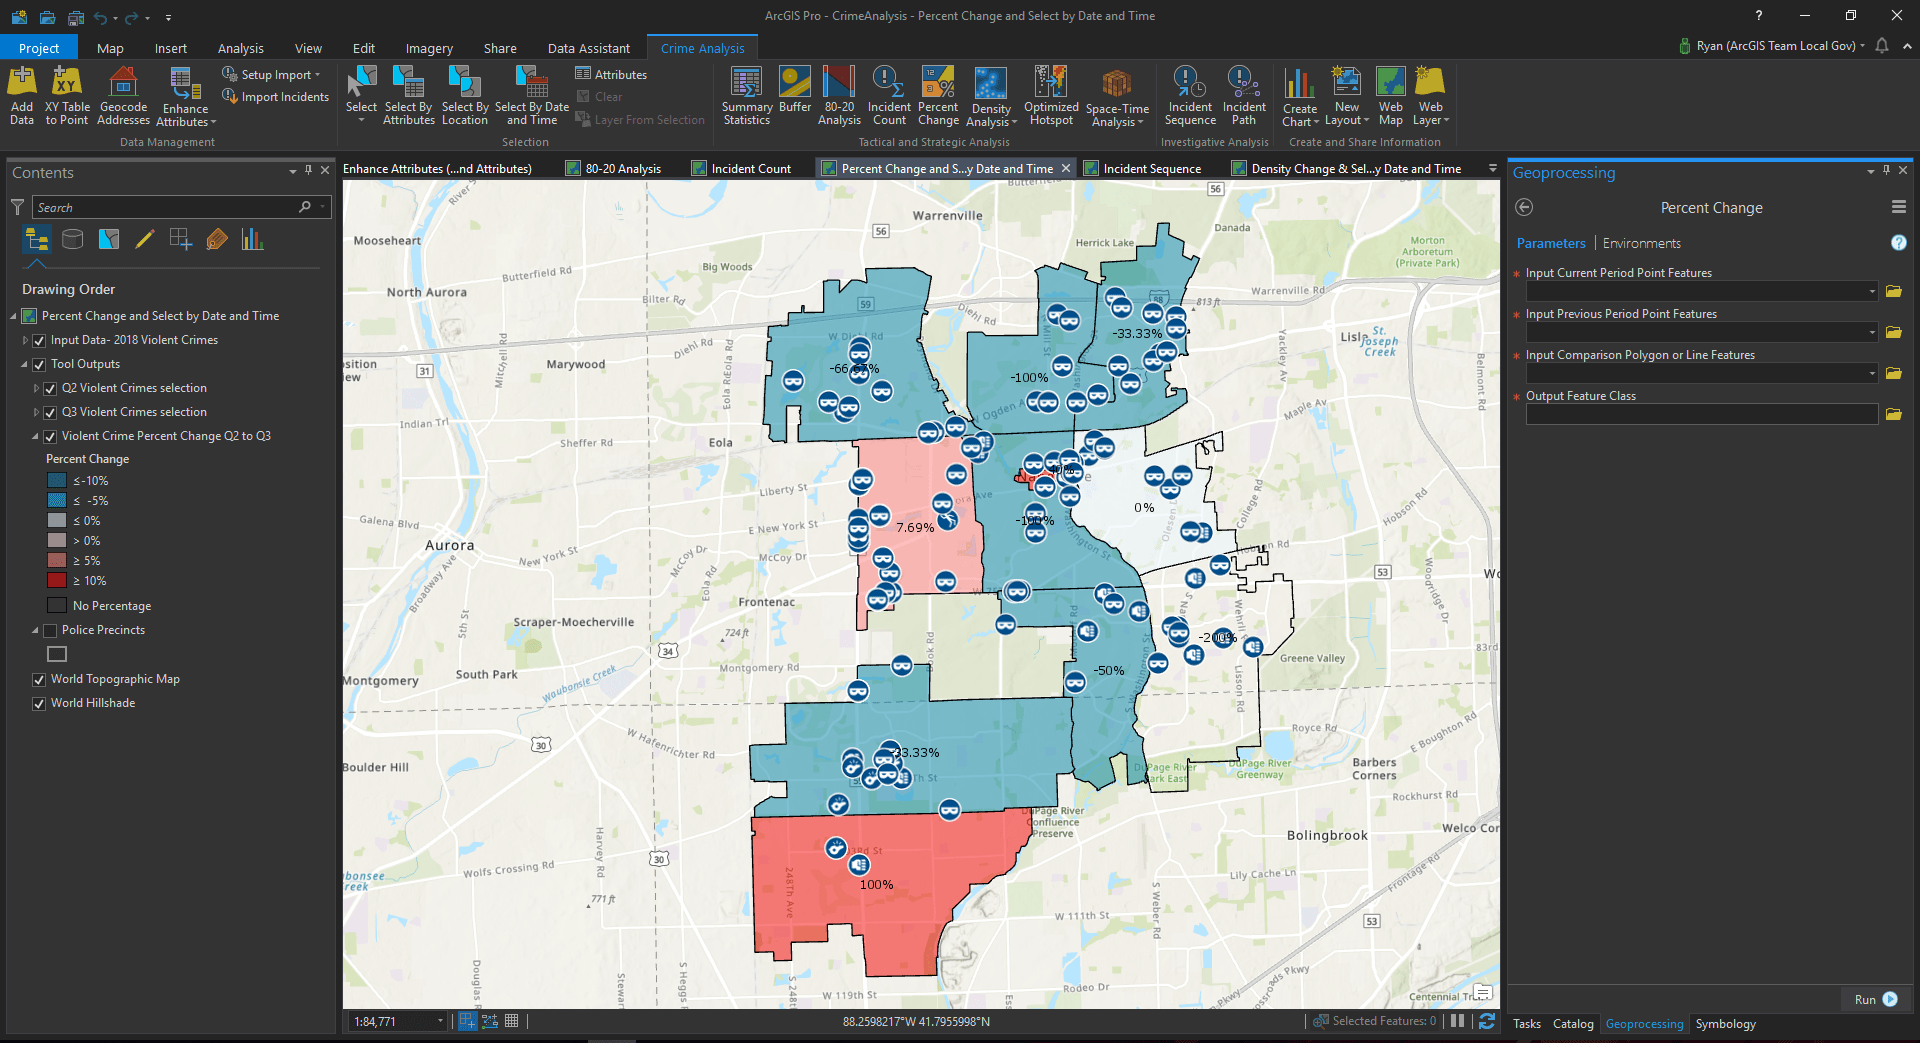
Percent Change calculates the percentage change for each polygon in a layer by using input point layers representing two comparison time periods.
Density Analysis supports the common analytic mapping function of creating density maps to support exploration of clusters of incidents.
Kernel Density calculates a magnitude-per-unit area from point or polyline features, using a kernel function to create a raster output surface.
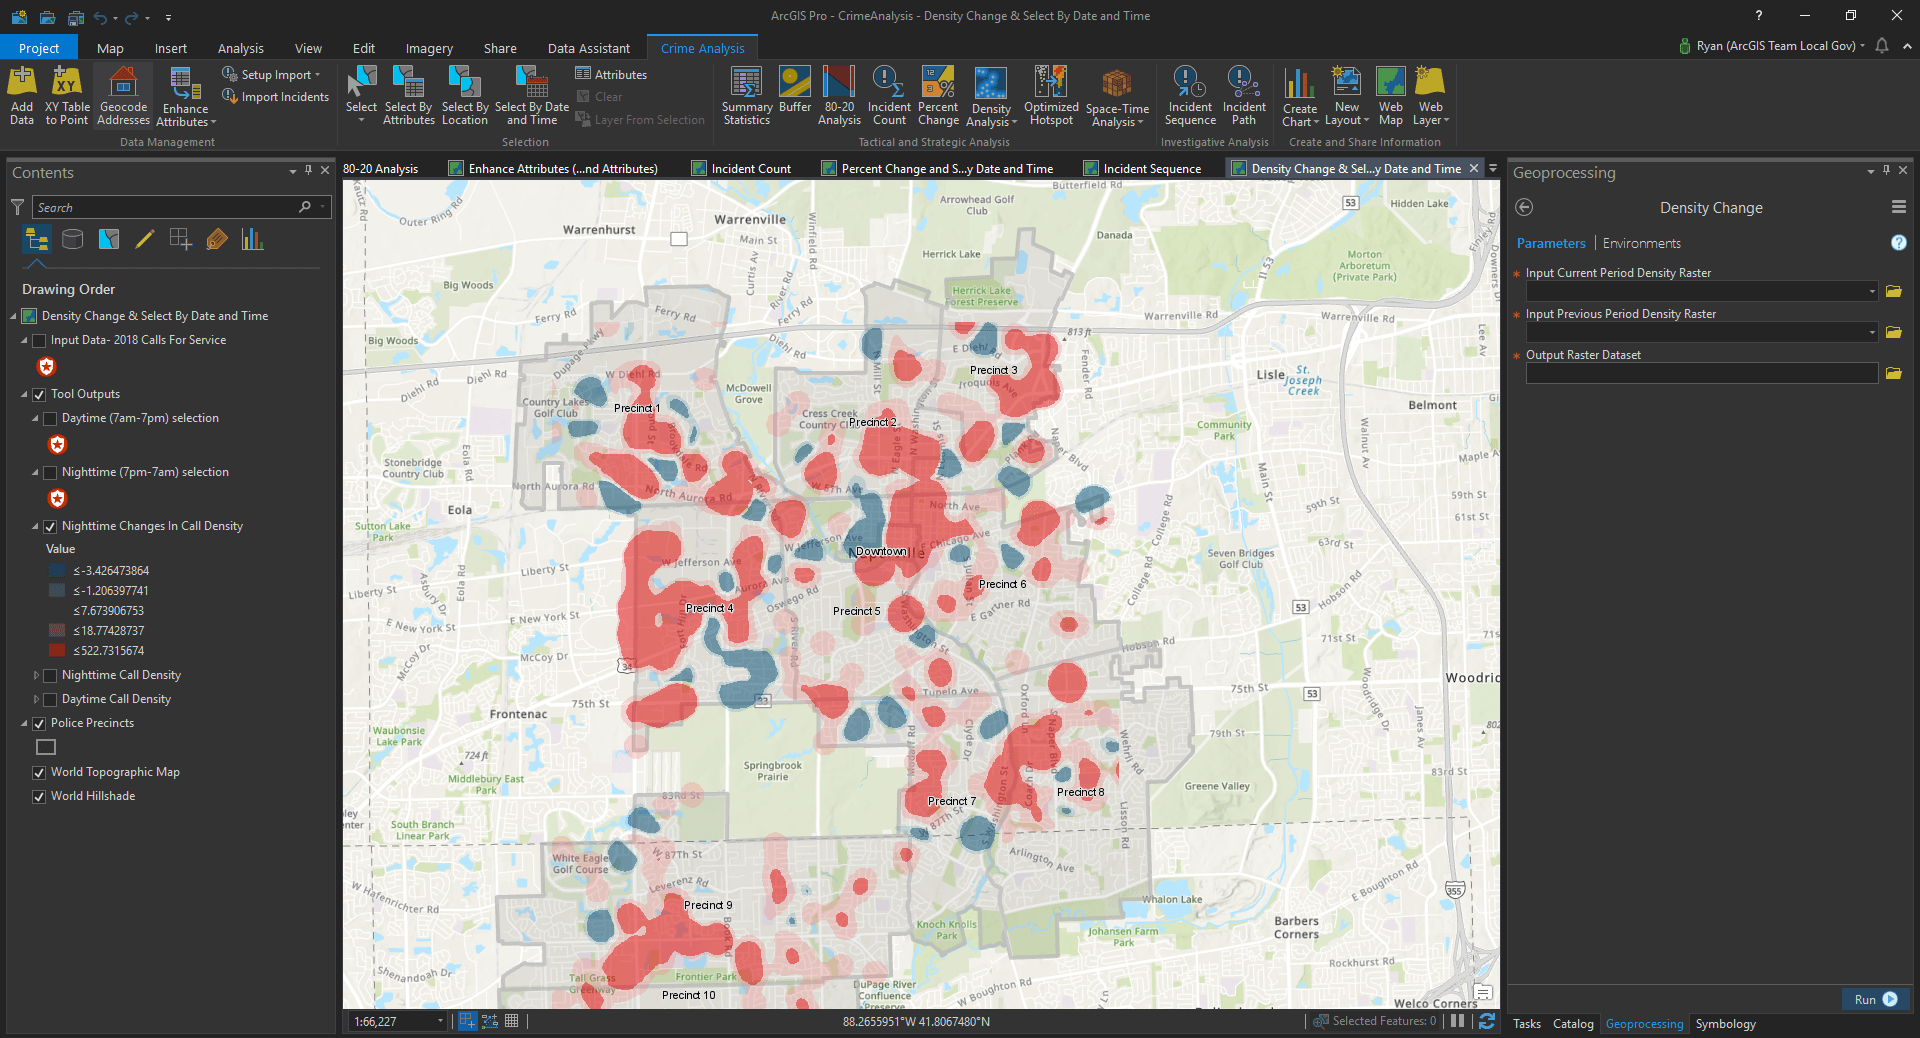
Density Change creates a raster output that shows change between two kernel density outputs. This tool can help illustrate how kernel density hot spots have changed between reporting periods.
Optimized Hot Spot —This tool takes incident points or weighted features (points or polygons) and creates a map of statistically significant hot and cold spots by using the Getis-Ord Gi* statistic. It evaluates the characteristics of the input feature class to produce optimal results.
Space-Time Analysis Tools—These tools can be used to analyze both the spatial and temporal aspects of your data and their context to each other. They also leverage spatial statistics and give outputs in 2D or 3D
Create Space-Time Cube by Aggregating Points summarizes a set of points into a network Common Data Form (netCDF) data structure by aggregating the points into space-time bins. Within each bin, the points are counted and the specified attributes are aggregated. For all bin locations, the trends for counts and summary fields are evaluated. The finished output can be thought of as a three-dimensional cube made up of bins, with x and y representing space and t representing time.
Emerging Hot Spot identifies trends in the clustering of point densities (counts) or values in the Space-Time Cube and categorizes hot spots as new, consecutive, intensifying, persistent, diminishing, sporadic, oscillating, or historically hot or cold.
Investigative Analysis
These tools include two new functions in ArcGIS that support link analysis workflows to aid investigations by looking at relationships between incidents, suspects, locations, and time.
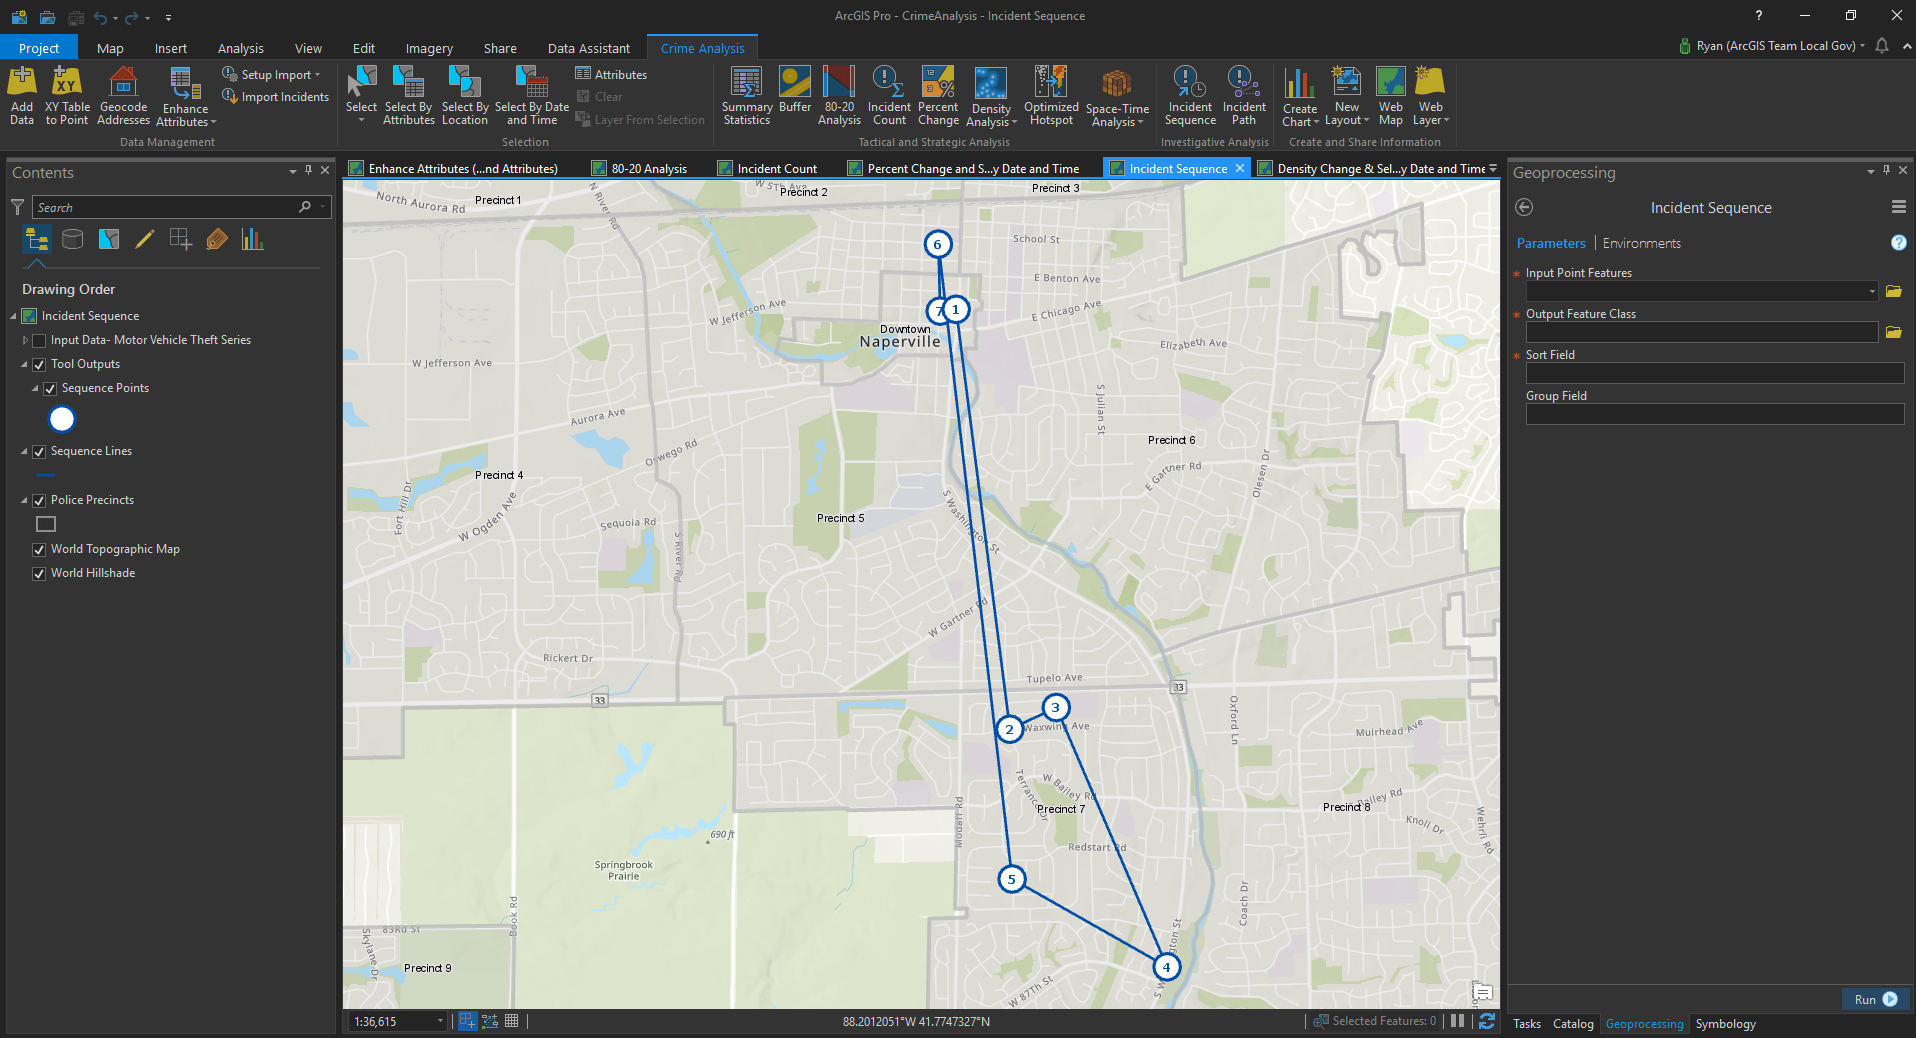
Incident Sequence creates sequential connecting lines between related incidents based on a date field. The output will show the order and direction of the related incidents.
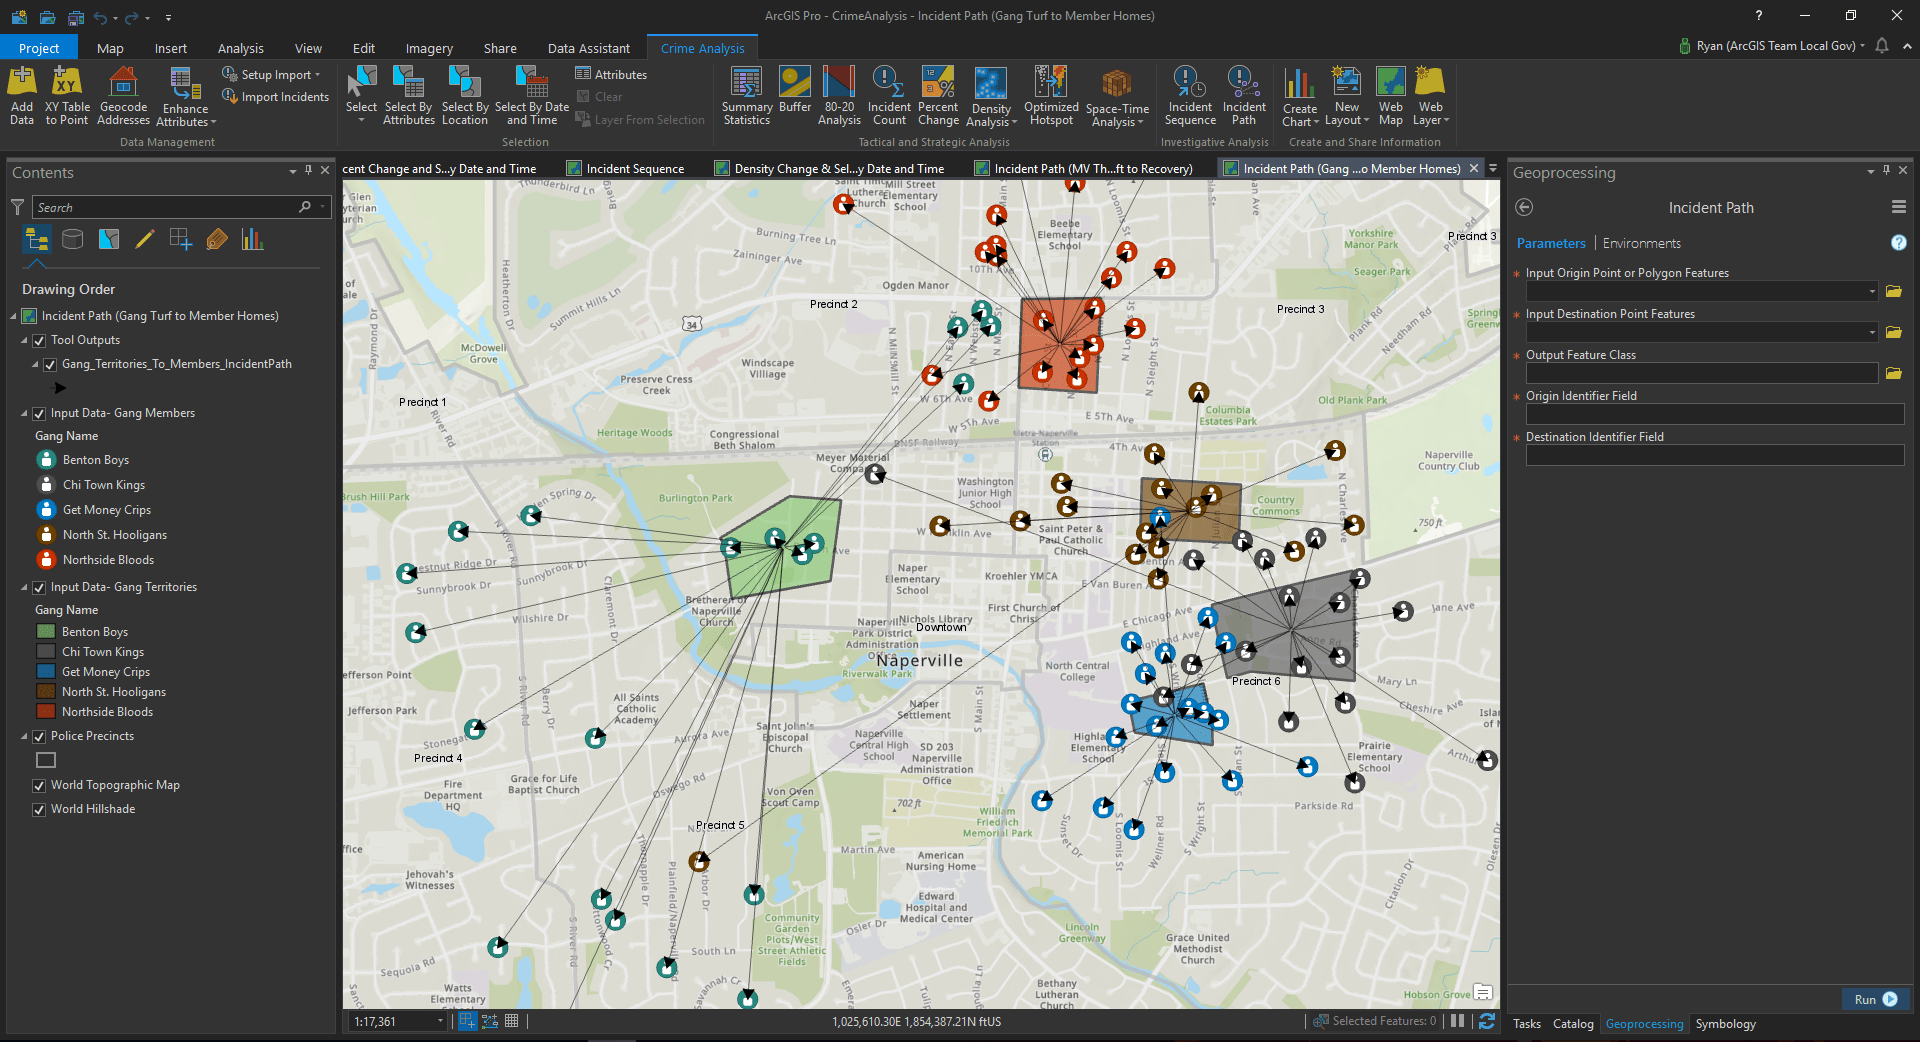
Incident Path creates linking lines between two layers based on unique identifiers. This tool can be used to identify relationships that are one-to-one (such as motor vehicle theft to recovery locations) or one-to-many (using spider diagrams of relationships like gang territory-gang member locations). This tool can also show the fastest route on an existing street network (this function consumes credits).
Creation and Sharing of Finished Information Products
Lastly, this set of tools in the new solution enables analysts to easily share their information products with others.
Create Chart, use charts to visualize categories, distributions, change, and other relationships in your data. In the upcoming ArcGIS Pro 2.2 release, the new Data Clock chart type will provide another method to visualize temporal data.
New Layout creates a layout and adds it to your project. The new layout is saved in the project, and you can select a preset layout, create a custom layout, or import a layout file from another project.
New Web Map gives you the ability to quickly share your map as a new web map via your ArcGIS Online organizational account.
New Web Layer enables you to either publish a new or overwrite an existing web layer in your ArcGIS Online organizational account.
We will be sharing a preview and overview of the new tools during our June 7 webinar, and the toolset will be released with the June 2018 ArcGIS update. Though we are excited about this new and powerful addition to the ArcGIS family of solutions, we are even more excited about the future of these tools. This solution will be organic and evolve to include new capabilities and enhancements in future releases. We plan on incorporating existing ArcMap solutions (cell phone analysis, repeat and near-repeat analysis) into a forthcoming release, but we also look forward to your feedback and input to help guide subsequent releases of the tools.
To learn more about these solutions, join us for the next edition of the Esri Law Enforcement Webinar Series
Jump start your organization by contacting us via email at publicsafetyinfo@esri.com

Commenting is not enabled for this article.