Visualizing and analyzing real time data is becoming increasingly important. Showing real time data on a map can notify you of earthquakes as they occur, or track things like hurricanes, emergencies, and even current traffic conditions. Information can be distributed much more quickly than with static maps.
With ArcGIS Pro 2.2 you can now display and analyze real time data with stream layers. A stream layer is a layer that is subscribed to a stream service, which is an ArcGIS Server service of real time data. Stream layers let you display events happening in real time and analyze those events.
Standard feature layers require explicit calls to a data source to refresh the map with current information. Stream layers are different. Current data is broadcast from the subscribed stream service to the layer automatically, the moment it happens in the real world. So, the stream layer always dynamically shows the most current information. These broadcast changes usually happen at irregular intervals, much like push notifications on a mobile device.
You work with and symbolize stream layers in much the same way you work with standard feature layers.
- Symbolize stream layer features with single symbol, unique value, graduated color, or graduated symbols symbology.
- Set definition queries to get filter the features that get streamed to your map.
- View the attributes of streamed features in the Attributes pane.
- Use stream layers in any Geoprocessing tool that accepts feature layers as an input.
You can optionally show the previous observations (or locations) of moving features such as taxis, emergency vehicles, or planes. You can differentiate the current (latest) observations from previous observations with different symbology.
Stream layers are all about real time data.
How do you add a stream layer to a map?
You add stream layers to maps and scenes the same way as other layer types. Here is one method.
- On the Map tab, in the Layer group, in the Add Data menu
 , click Data From Path
  .
. - Enter a URL to a stream service and click OK.
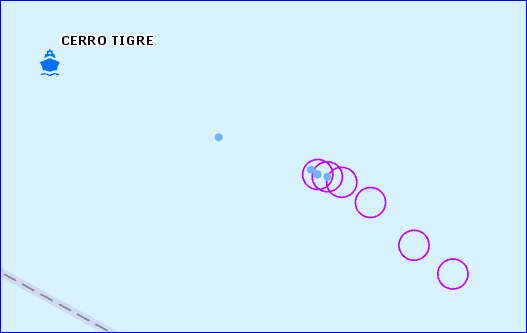
A sample stream service you can try is https://geoeventsample1.esri.com:6443/arcgis/rest/services/PanamaTugBoat/StreamServer - In the map you will see points representing tug boats in the Panama canal begin to appear as they move along their tracks.
Note: these data, broadcast from PanamaTugBoat stream service, are simulated.
How do you symbolize streaming features?
Stream layers are symbolized the same way as other layers.
- Under Stream Layer on the Appearance tab in the Drawing group,
expand Symbology and choose a symbology option.
 - When a stream layer is track aware, like this PanamaTugBoat layer is, you can also symbolize previous observations from the Previous tab on the Symbology pane
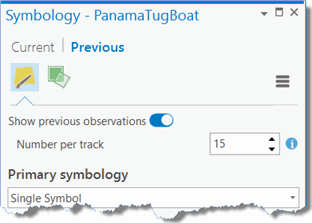
Stream Layer Previous Symbology Tab
How do you limit streaming data?
Sometimes a map gets cluttered with too many streamed observations to give meaningful information. Examples where this might occur are monitoring flights across the globe or tracking taxis in New York City. There are a few ways to limit the number of observations shown:
- Apply a definition query to the stream layer. In this case the source stream service only broadcasts features that meet the definition query. When a new definition query is applied (or an existing one is modified) all existing observations will be cleared from the map before streaming resumes.
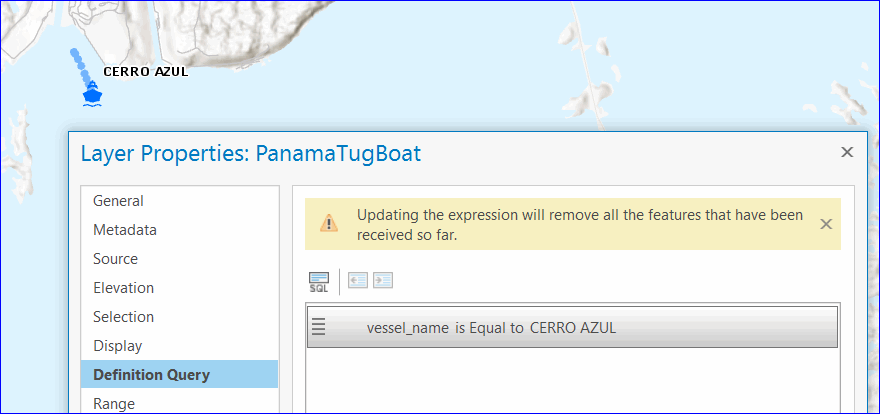
A stream layer showing only the tug boat that meets the definition query - Use Previous tab on the Symbology pane to hide previous observations from the display and control the number of previous observations per track (or per moving objects.)
- Set observation expiry. Under Stream Layer on the Data tab, set Observations Expire After option to limit the number of observations that are stored in memory.
Perform analysis using features from a stream layer
You can perform analysis with stream layer features. Input stream layers (or a selected subset of stream layer observations) into any geoprocessing tool that accepts feature layer inputs.
It is good practice to stop streaming when running a tool on a stream layer, since the stream layer constantly changes; otherwise you will see inconsistencies between output in the geoprocessing result and streamed features you see on the map.
For more information on stream layers and stream services, please visit following links:


Article Discussion: