The purpose of this blog is to give an overview of the recently released Water Outage template and to answer the question we’ve been asked a lot the last few weeks… “Hey, where’s my utility isolation trace?”
What is the Water Outage template?
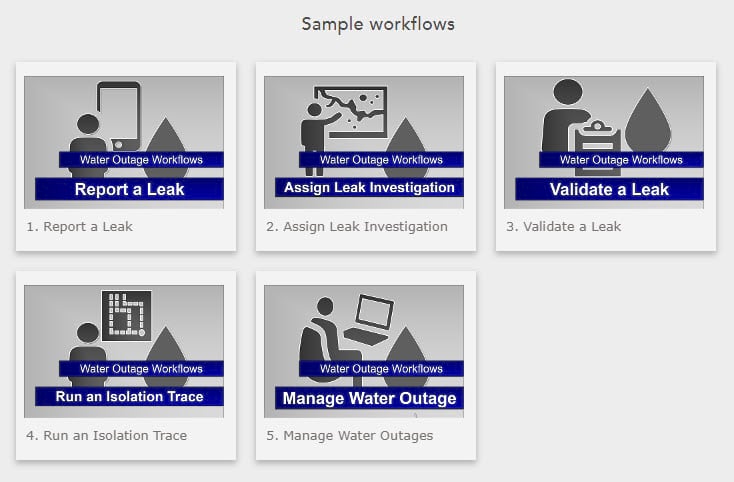
The Water Outage template enables an organization to deploy a series of maps, apps, and workflows that enable water utilities to investigate leaks and main breaks, understand impacts to your water system and customers and manage any service outages. This template accounts for each step in the lifecycle of a leak or break. These steps are: reporting the leak, validating the leak, investigating the leak, running the isolation trace to determine the extent, and managing and communicating the outage. We have prepared story maps that show each step in detail.
So… the Utility Isolation Trace template grew up, got more capabilities and became part of the new Water Outage template. The isolation trace included with the Water Outage template has been enhanced to perform a true isolation trace. Consequently, the old Utility Isolation Trace template moved to Mature Lifecycle Phase.
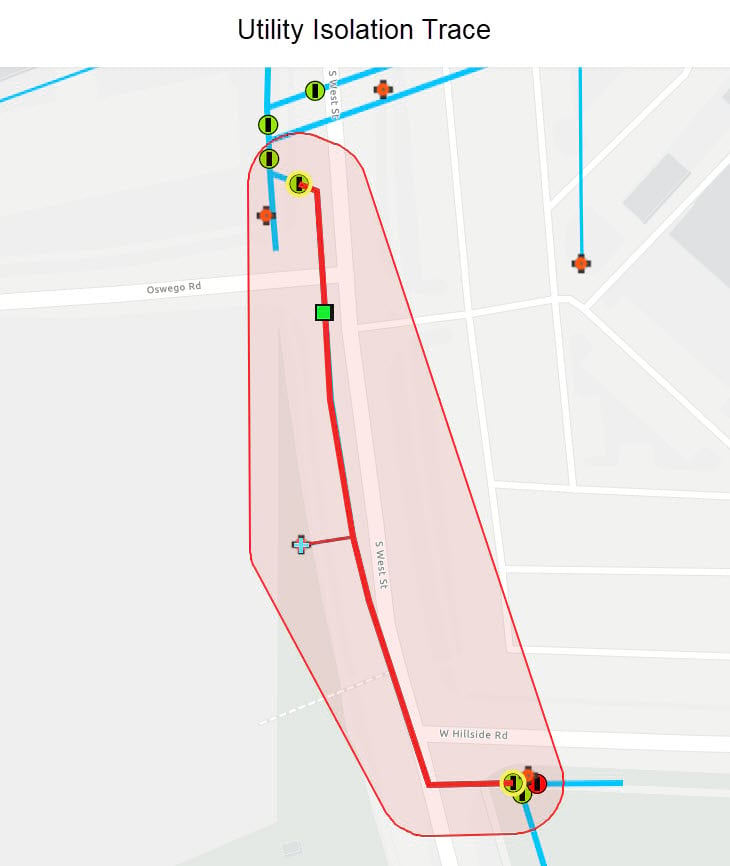
As those of you who used the Utility Isolation Trace template experienced, it performed a simplified trace and only returned the valves closest to the leak or break. So, when a break occurred on or near a dead end water main, the results of the trace could be inaccurate. If you wanted to run a true isolation trace you had to use ArcMap.
For example, if a break occurred on the main pictured below, the Utility Isolation Trace template would return two isolating valves and only one hydrant out of service. Since the area south of the break is a dead end, the results are incomplete and misleading.
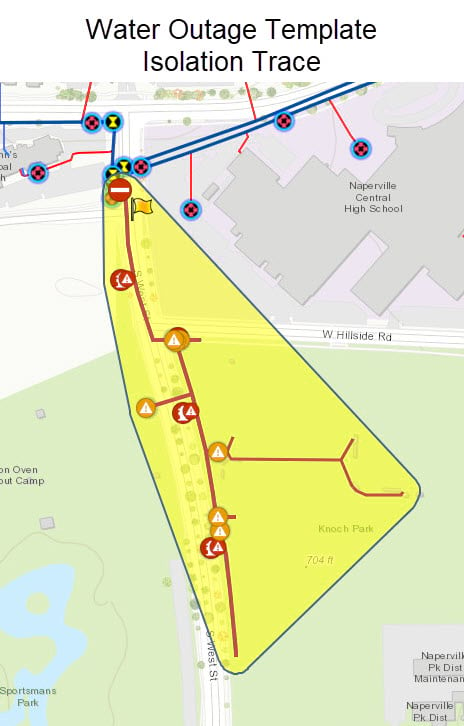
The isolation trace deployed with the Water Outage template can ensure a valid path to a source, which means it will return an accurate result. So the break on the same main using the new trace returns the correct result of only a single isolating valve and three hydrants out of service.
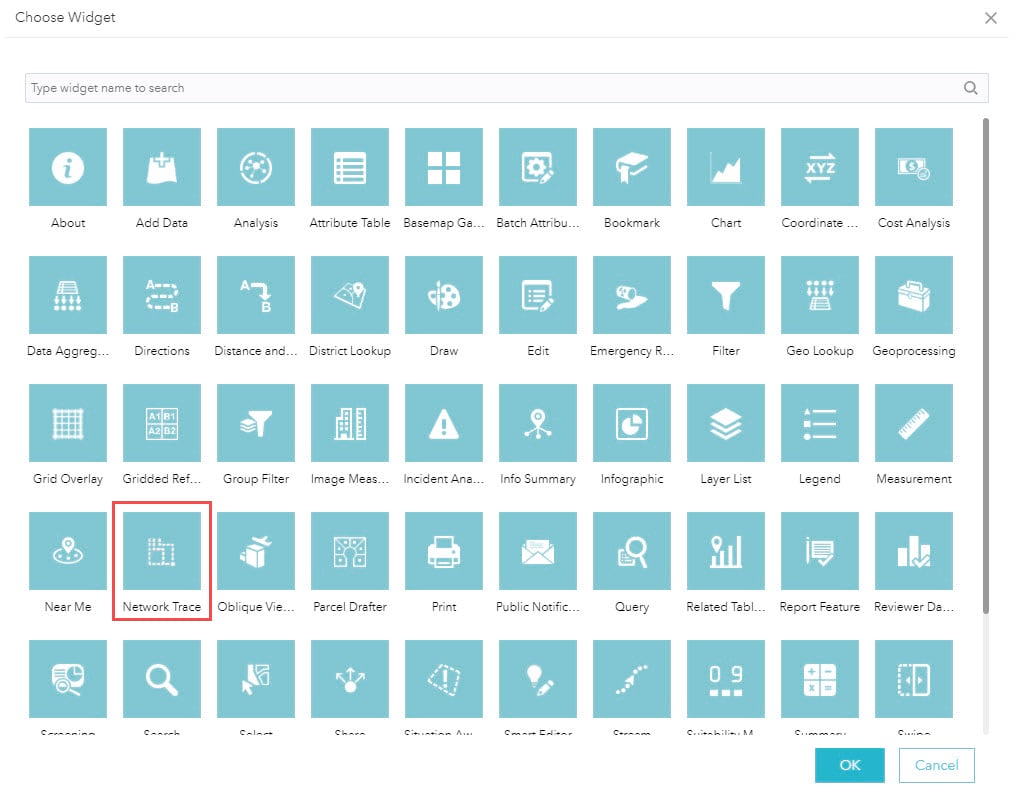
We’ve also added the Network Trace widget that the Water Outage template uses to Web AppBuilder for ArcGIS. It is available now in ArcGIS Online and it will be added to Portal for ArcGIS at the next release of ArcGIS Enterprise.
The old Utility Isolation Trace template required you to use Web AppBuilder for ArcGIS (Developer Edition) and host the web application yourself. So the Water Outage template streamlines the deployment process.
Of course, you still need a geoprocessing service to configure the Network Trace widget. We’ve enhanced that documentation and you can find it here.
So, if you are a utility looking for a better way to respond to leaks and main breaks and can perform a do it yourself implementation, check out the Water Outage template. The Get Started page for step by step instructions on how to deploy the Water Outage template to your ArcGIS Online organization.
If you are interested in getting these capabilities and don’t have the required environment, technical skills or time to do it yourself, contact Esri and our professional services can help you.
And for those of you looking for the utility isolation trace… you found it… one of the critical components in the larger workflow the Water Outage template supports.


Commenting is not enabled for this article.