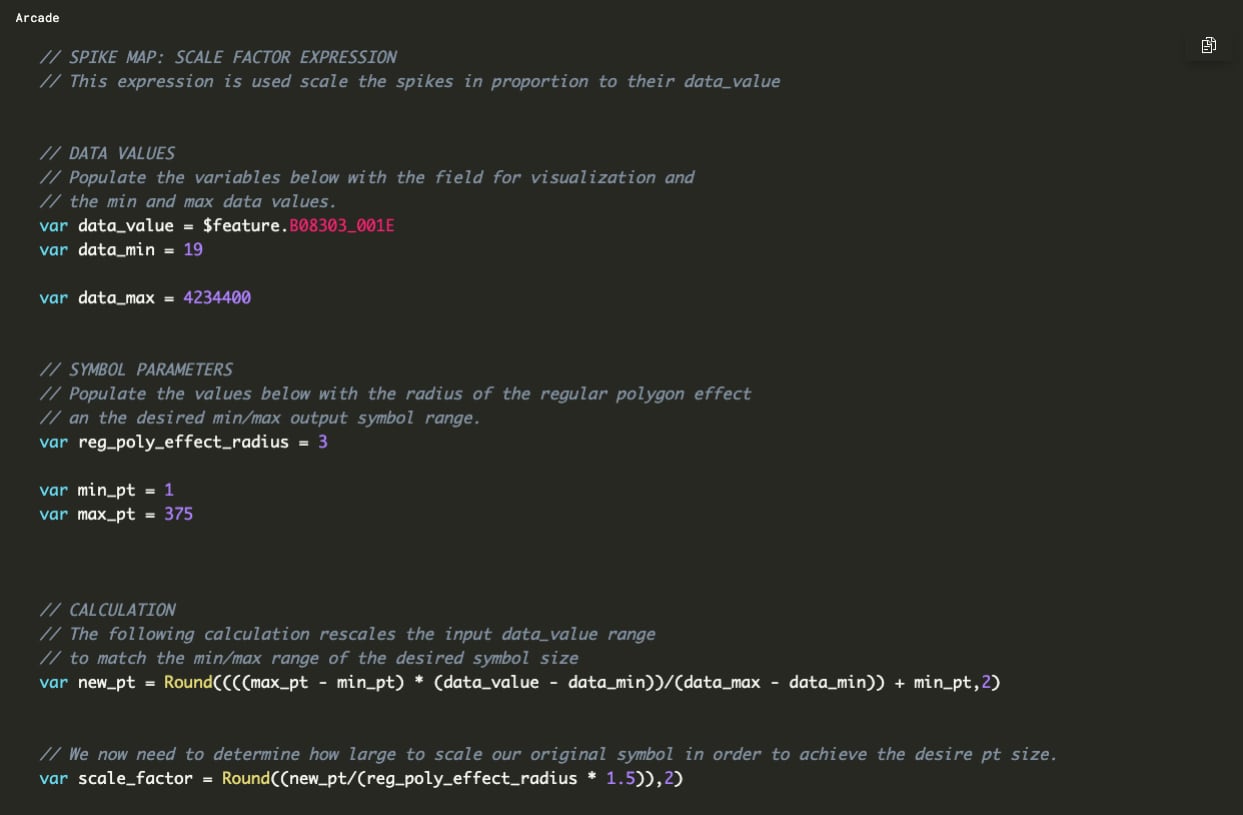
Among other recent enhancements, did you know you can now share code snippets in your stories using the code block? This new block provides a place for authors to share snippets of code relevant to their story and supports a variety of syntax highlighting for popular development languages.
As someone who loves sharing how-to resources, this is a valuable feature that allows me to include all the little code snippets that make up a project as part of the story. This way, I can contextualize the blocks of code and even demonstrate their effect within a subsequent interactive web map or pop-up.
I also love reading how-to resources. In particular, I enjoy those stories that illustrate their data analysis process. Whether as part of the primary story or as a supplemental technical story, well-commented code snippets can go a long way in explaining the methodology behind these stories and help others get a jump start on their projects.

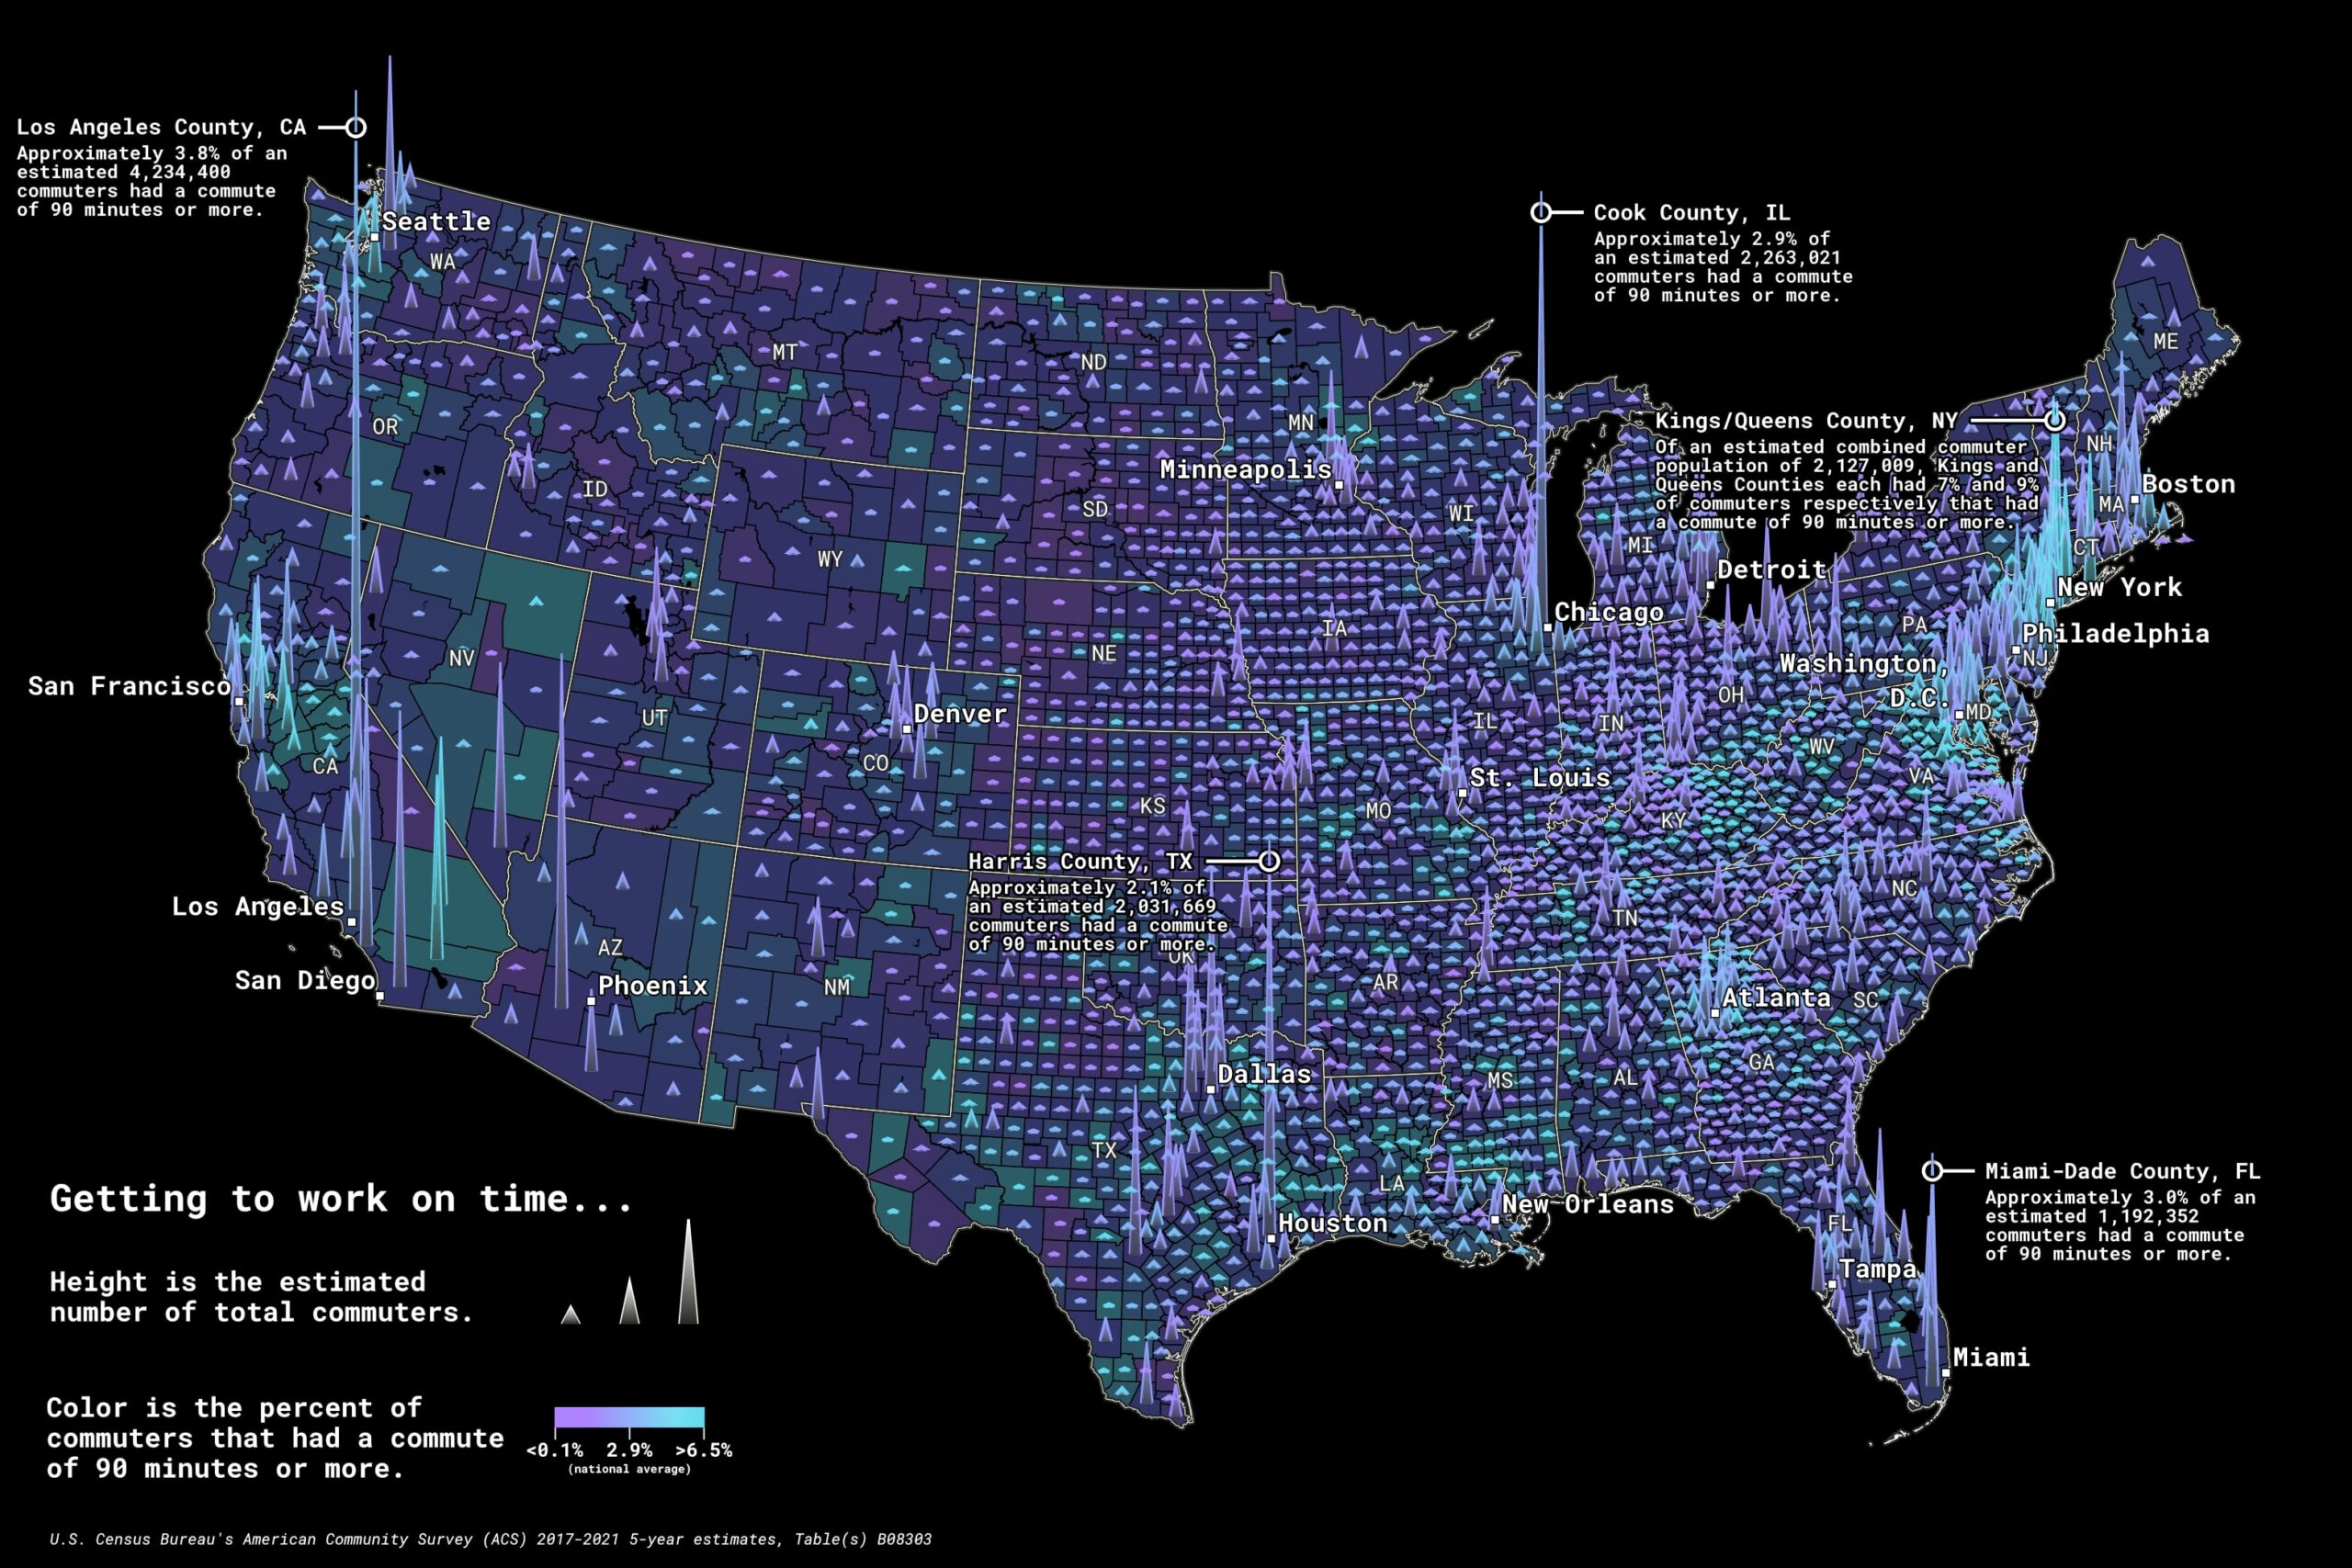
So when the code block was released, I jumped at the chance to use it. Coincidentally, I was experimenting with combining symbol effects and Arcade expressions to create spike maps in ArcGIS Pro. These spike maps were the perfect test for the new code block and a symbology deep dive story.
The story briefly overviews spikes as proportional symbols, how to create the spike using symbol effects, and how to dynamically scale them using Arcade expressions. The expressions, styles, and project package are all shared, so you can easily apply them to your own projects.


Article Discussion: