The world is becoming increasingly connected: millions of sensors and devices measure and share a wide variety of data in real-time. Today, organizations of all kinds are looking to leverage the massive velocities and volumes of IoT sensor data to monitor, manage, and optimize critical assets.
To take full advantage of the data being generated by sensors and IoT devices, three fundamental things need to be performed at scale:
- Real-time streams of data need to be ingested successfully.
- Ingested data need to be analyzed as it is received.
- Real-time analytics need to trigger appropriate actions.
ArcGIS Velocity, a new real-time and big data capability for ArcGIS Online, is designed to specifically meet these challenges. Velocity uses distributed cloud processing to scale the ingestion, analysis, and storage of large volumes of spatial data at remarkably high speeds. Organizations can leverage Velocity to configure feeds to pull streaming data, design real-time analytics to process and analyze each observation as it is received, and prompt a result or action to be taken as an output.
At the Developer Summit 2021 plenary, Suzanne Foss demonstrated how the California Department of Toxic Substances Control (DTSC) uses Velocity to leverage real-time data to monitor the location of hazmat trucks and safeguard sensitive populations from exposure to hazardous waste. Watch the plenary video below, and then read the rest of the blog for a summary of the processes that Suzanne explored in her demo.
Create a feed
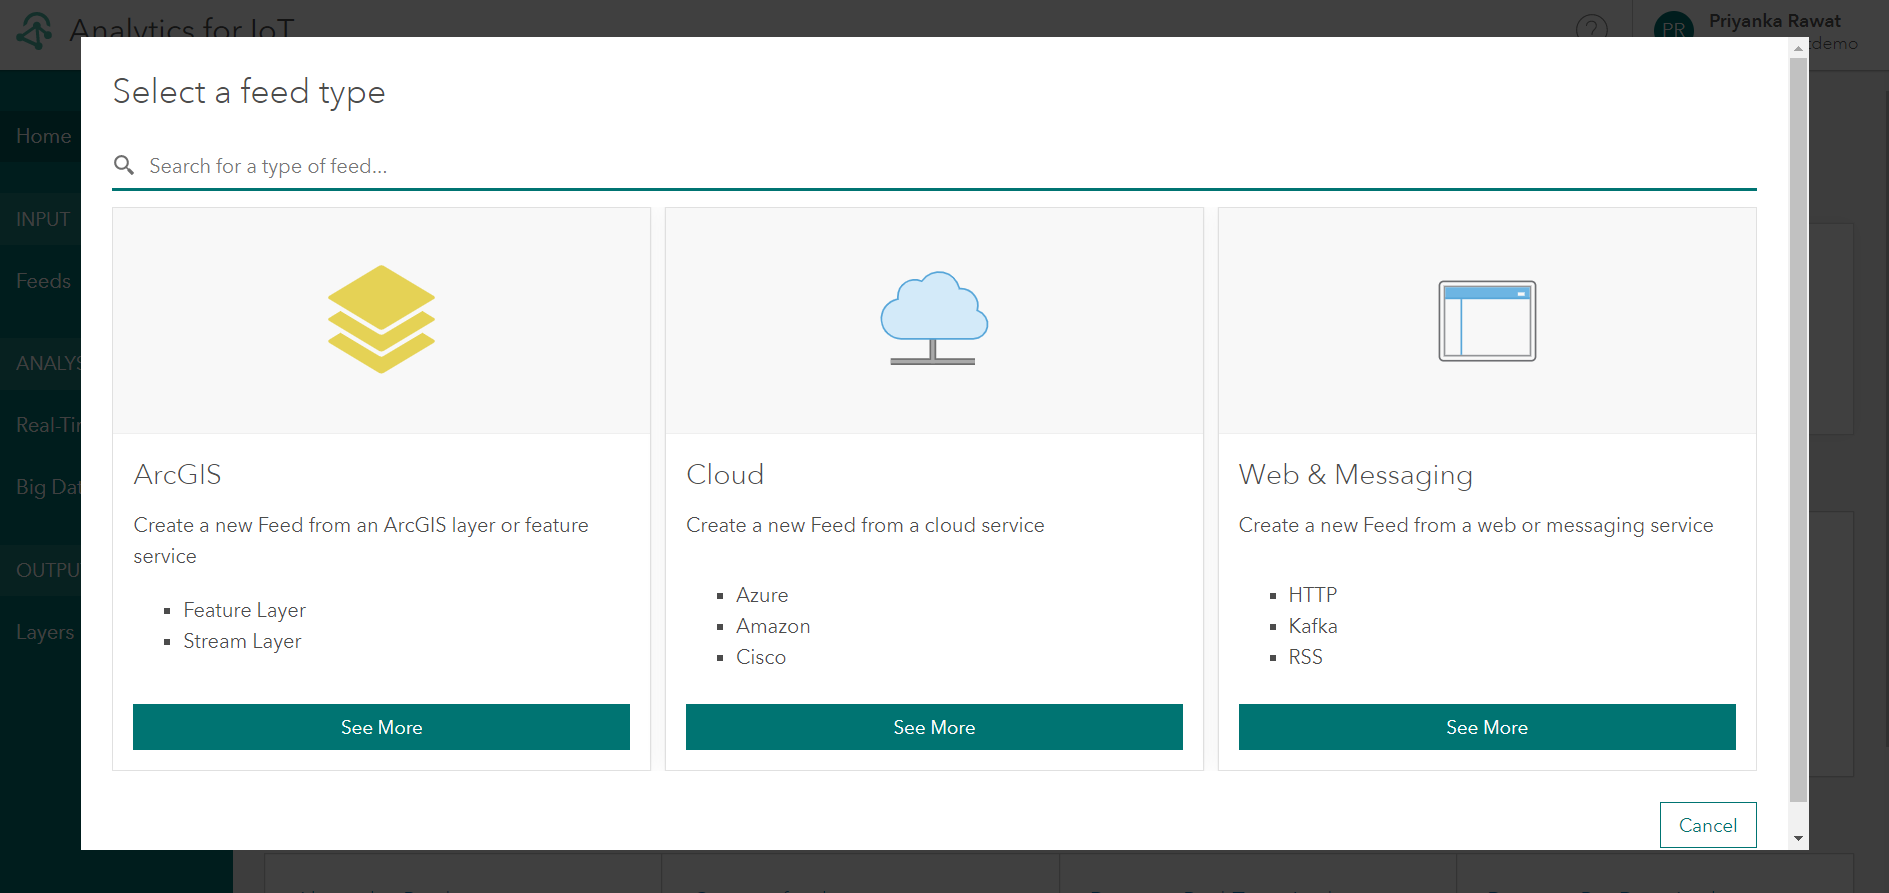
First, Suzanne showed how easy it is in Velocity to create a feed that allows you to ingest real-time streams of data, such as the locations of the hazmat trucks transporting hazardous materials. An intuitive wizard helps you seamlessly configure a feed to bring in data from your ArcGIS layers, IoT cloud service providers such as Azure and AWS, and industry message brokers such as Kafka, MQTT, and RabbitMQ.
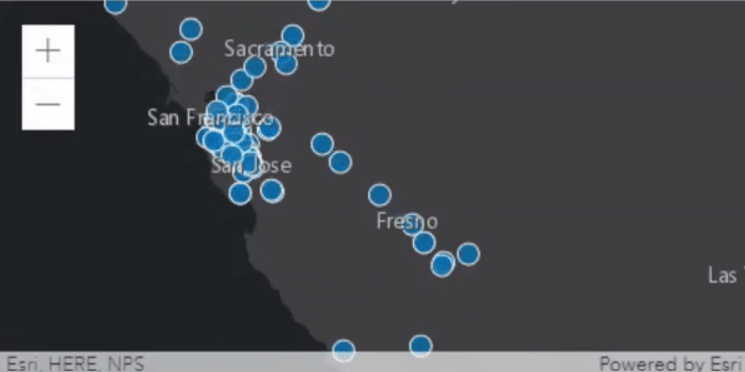
Feeds continuously ingest incoming data from the configured platform and light up your maps with streaming information.
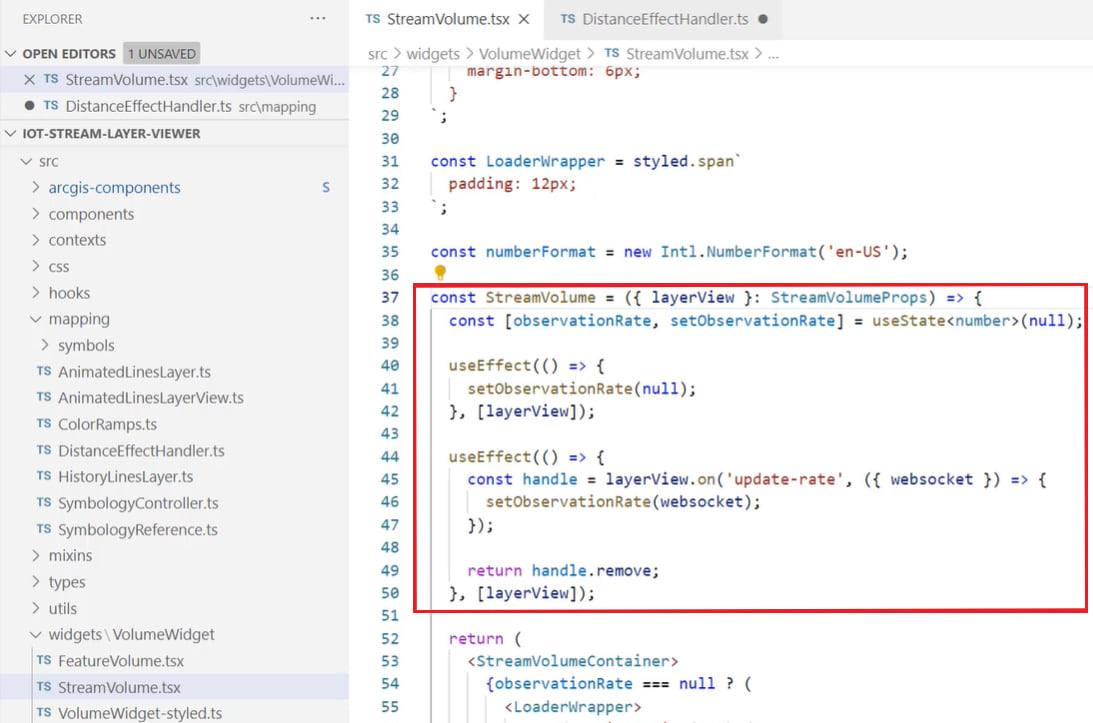
She then showed how developers can display real-time observation metrics on their users’ dashboards. You can get this information by accessing the update-rate event found within the StreamVolume functional component in the StreamVolume.tsx file.
Perform real-time analysis and trigger actions
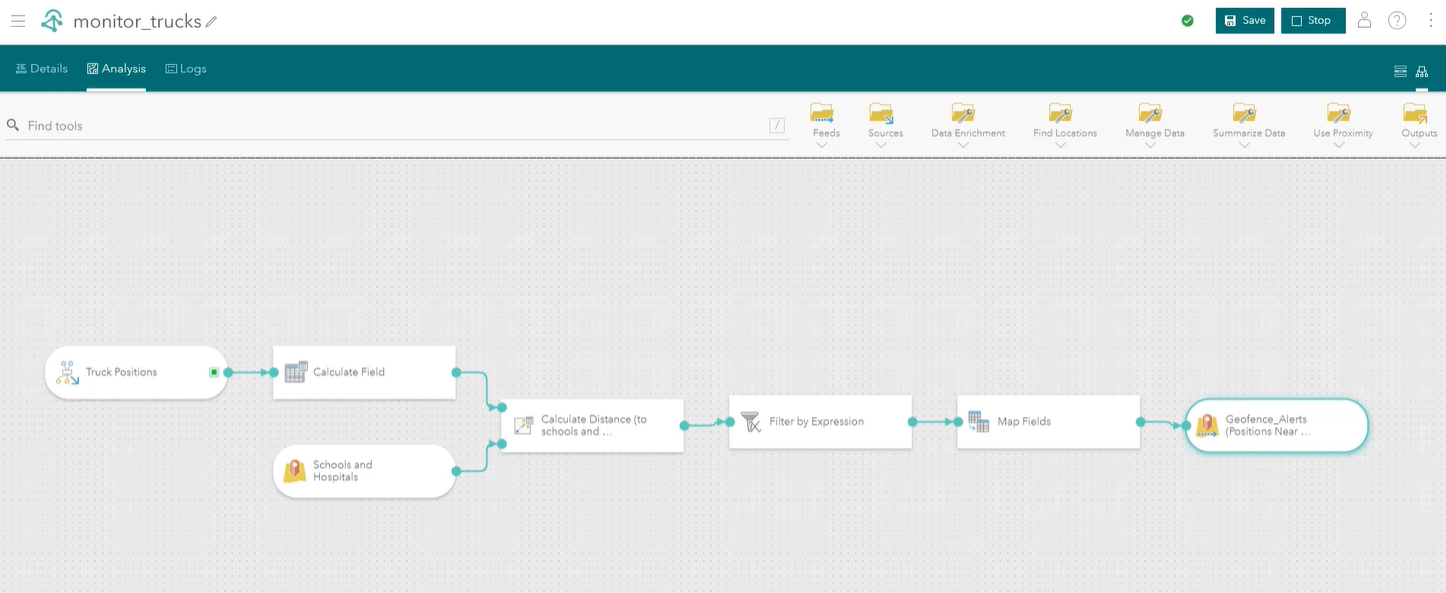
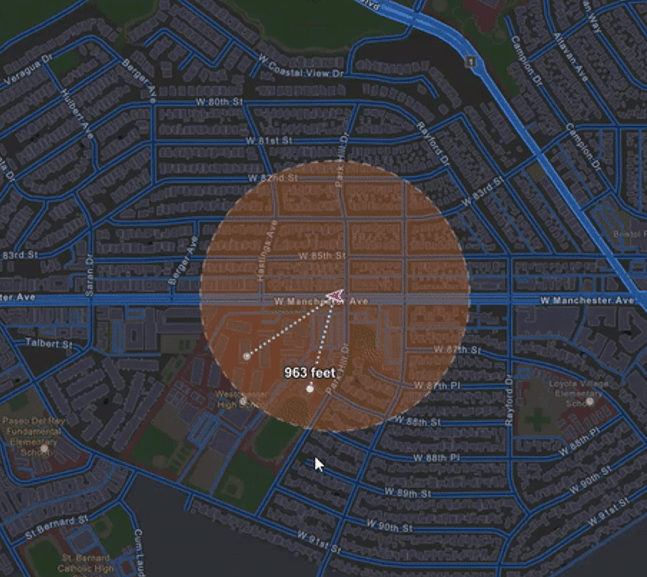
Next, Suzanne showed how the DTSC leverages Velocity to perform real-time analysis to ensure that the hazmat trucks do not come too close to sensitive locations like schools and hospitals. Velocity offers a visual model builder that enables you to quickly design real-time analytics from your data feeds and utilize them to make more informed decisions.
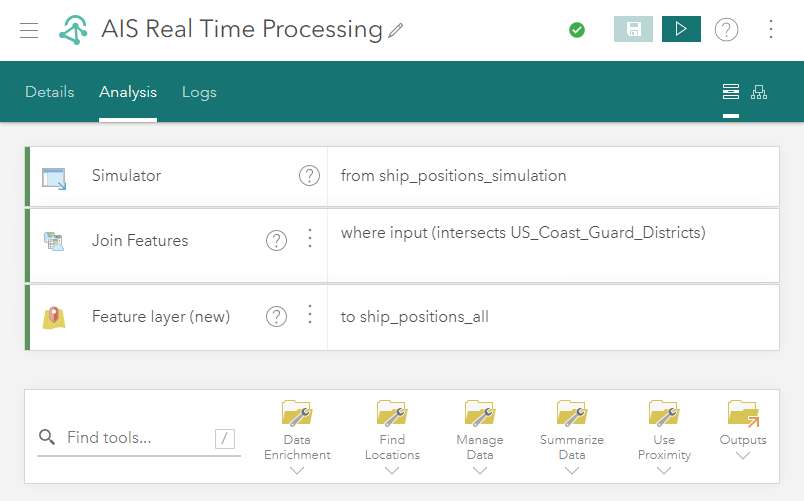
She described the real-time analytic that was designed for the DTSC’s use case—the analytic can georeference each incoming truck observation and geofence it against hospitals and schools in California, and instantaneously generate an output in the form of an alert if a truck is too close to the areas of interest.
Learn more
Suzanne’s demo showed how the DTSC uses Velocity to leverage real-time spatial data for remote monitoring of the hazmat trucks. To learn more about Velocity, visit the product page. Additionally, visit the Resources page to access product videos, quick lessons, documentation, and more.


Commenting is not enabled for this article.