Over 70% of the U.S. population resides in regions that receive snowfall in the winter months, and the increasing frequency and severity of snowstorms are subsequently consuming a larger percentage of operations and maintenance budgets every year. Cities and counties rely on prompt responsiveness of winter weather machinery to maintain free-flowing traffic.
Locating and tracking snowplow vehicles are critical to identify which roads have been serviced in real-time and optimize response activity. The Winter Weather Operations solution is used by government bodies to prepare and conduct response activities for extreme weather. This solution uses ArcGIS Velocity as an underlying framework and enables real-time data ingestion and big data analysis to make informed operational decisions.
Different components of the solution use different Velocity capabilities.
Ingesting real-time snowplow information
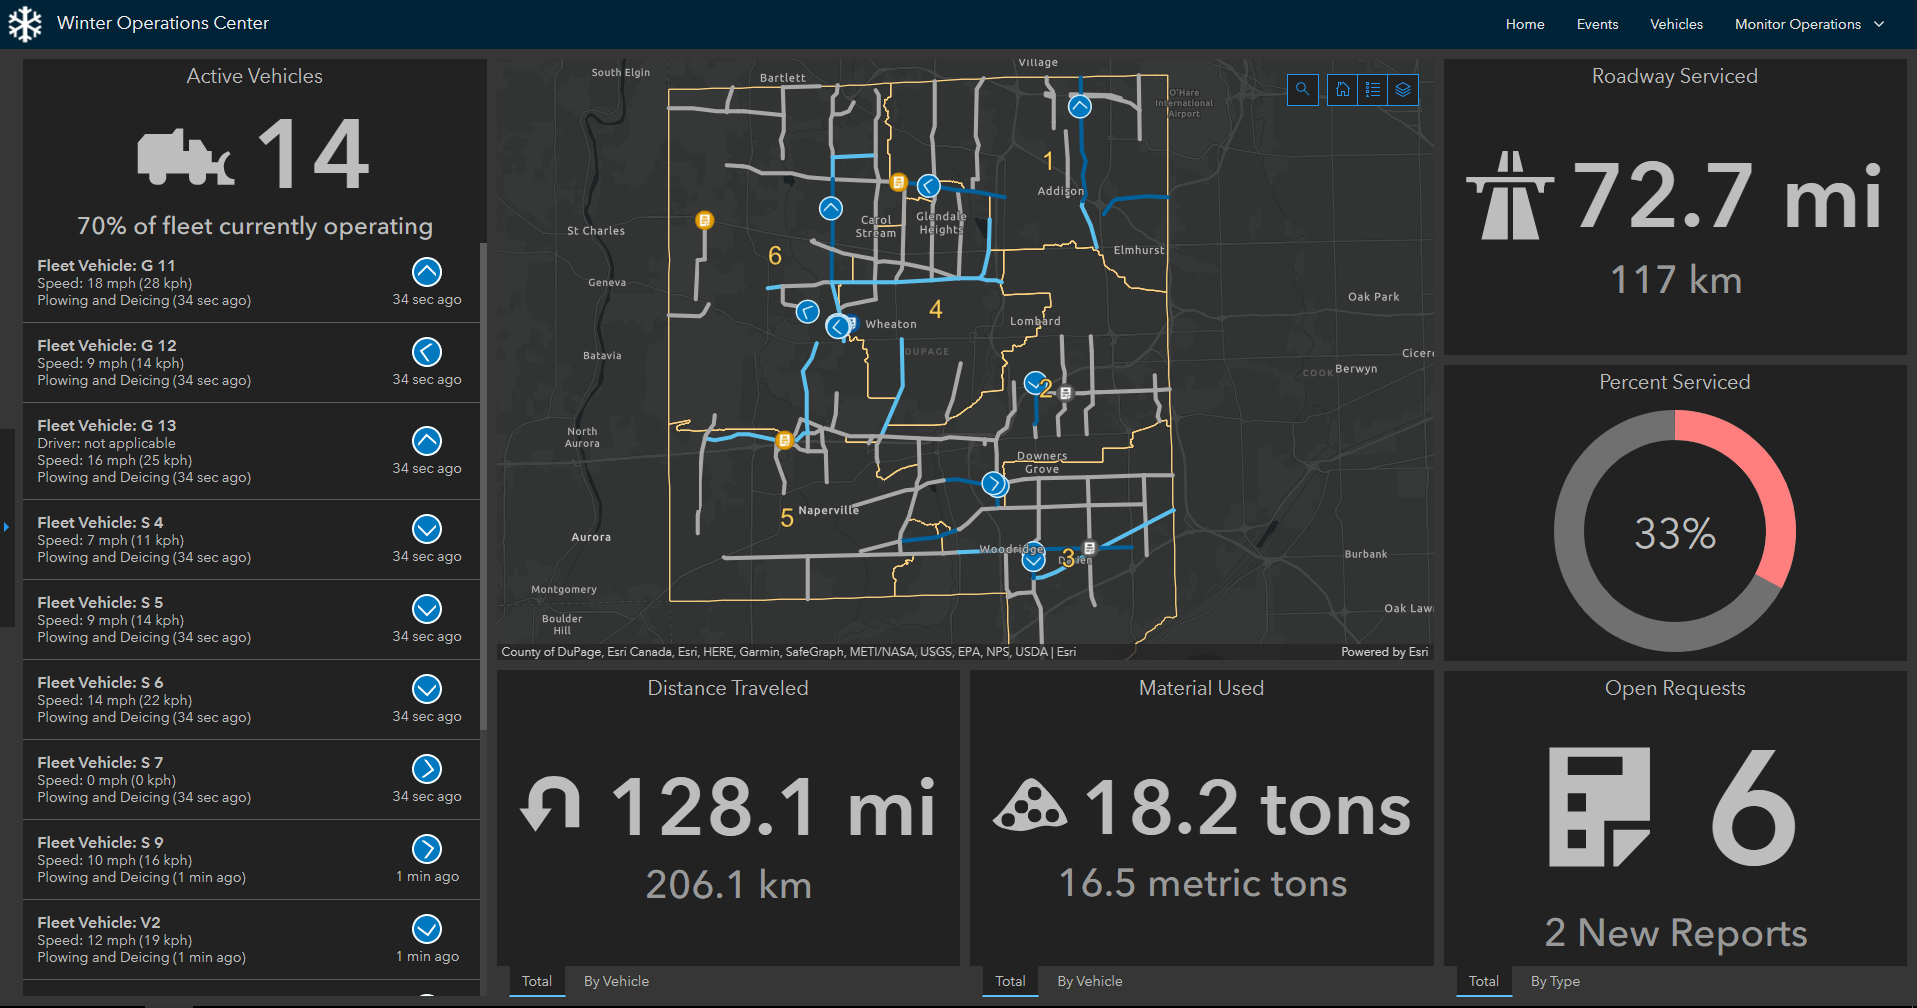
One of the fundamental elements in adverse weather response is coordinating snowplow operations. In the Winter Weather Operations solution, the Active Winter Event Dashboard equips operations managers with monitoring capabilities over snow response activities during a weather event. It displays the current and recent locations of all plows in the vehicle inventory.
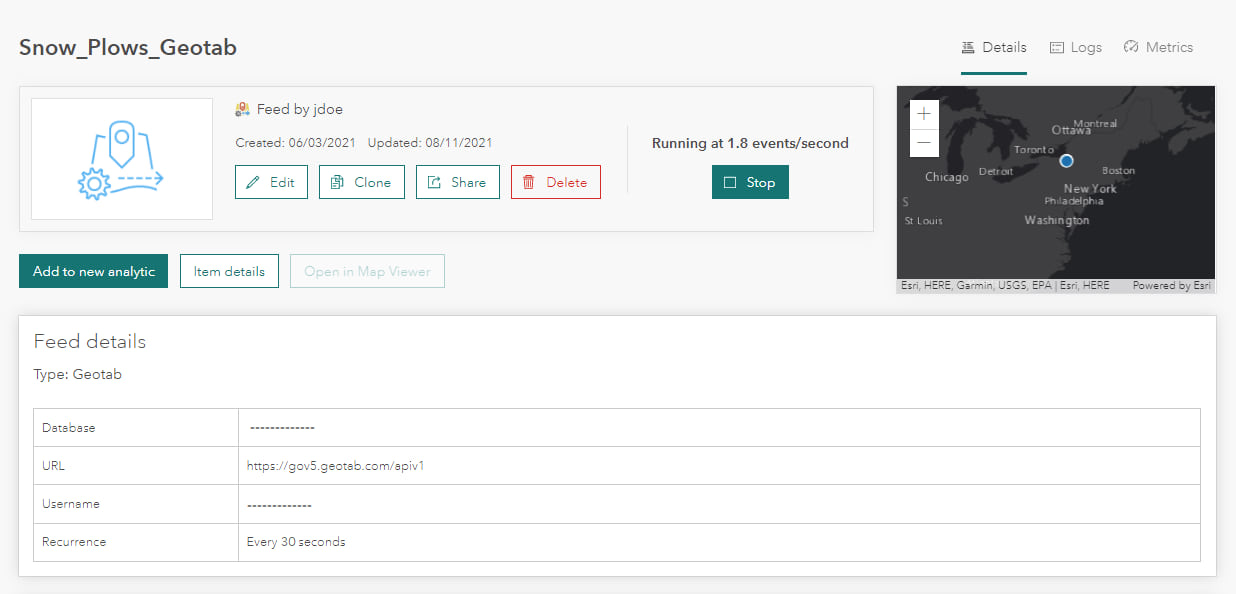
This live view of plow locations is driven by a real-time feed powered by ArcGIS Velocity. A feed is a real-time stream of data coming into ArcGIS from sources such as IoT platforms, message brokers, third-party APIs, or AVL tracking systems. Feeds parse real-time data and prepare it for visualization and analysis. In the Winter Weather Operations solution, feeds connect to and ingest location data from vehicles, whether that data is coming from ArcGIS location tracking or a vendor AVL system such as Geotab or Verizon Connect Reveal.
Real-time information on vehicle positions provides up-to-the-minute situational awareness and is used to determine what roads have been serviced in near real-time. Collecting this information over time enables the generation of value metrics and key performance indicators on the effectiveness of the response effort.
Tracking & managing operations progress
The Active Event Dashboard also provides information on the length and percentage of serviced roadways, the distance traveled, and amount of material deployed (i.e., salt). These metrics are calculated by leveraging the historical data of the vehicles’ movements collected during the current event.
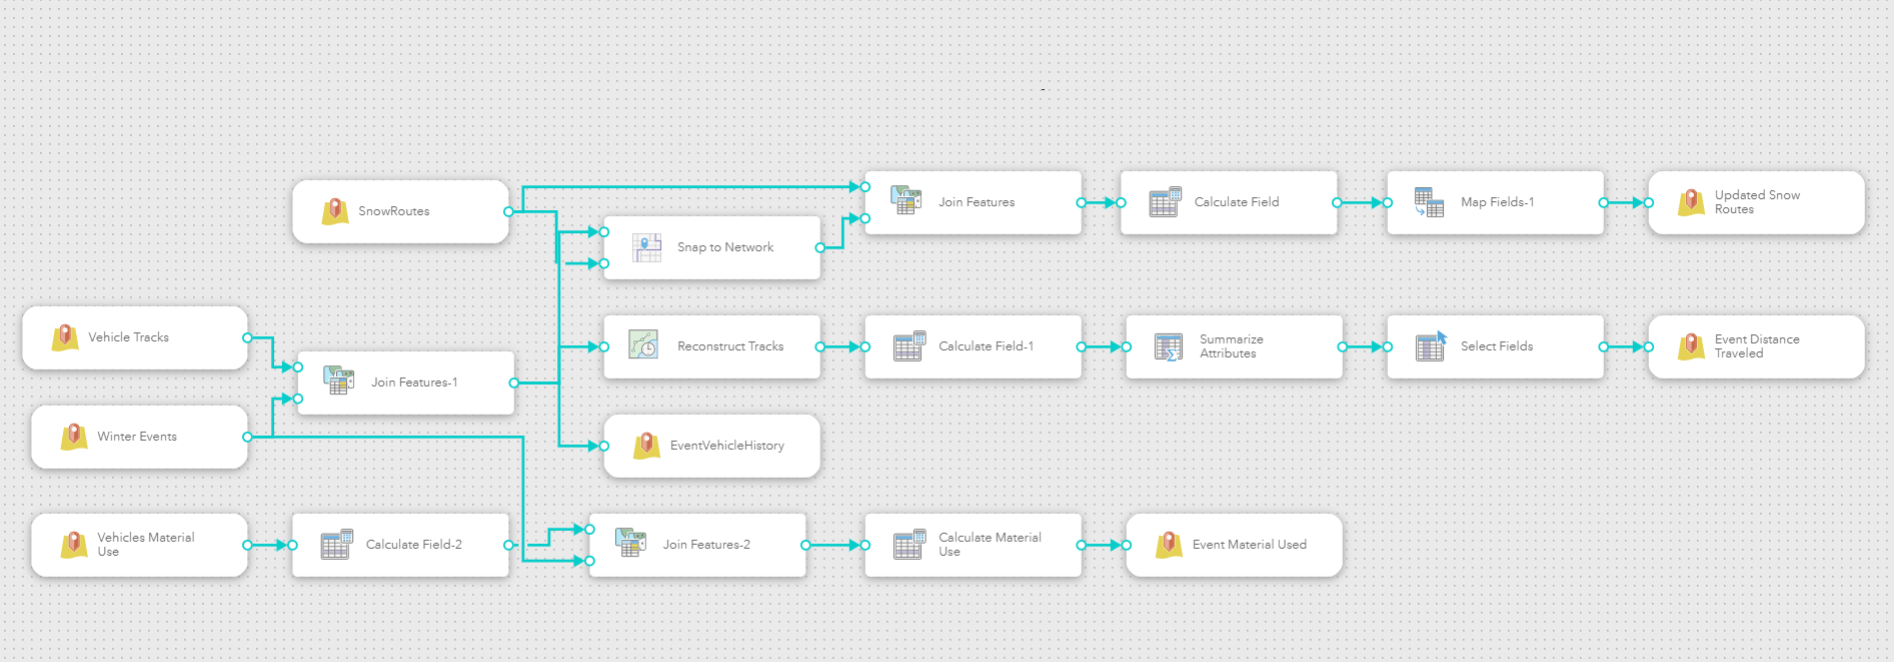
In ArcGIS Velocity, a real-time analytic is used to transform and store snowplow vehicle positions over time to a feature layer. First, vehicle information and service status information are merged, which allows the Winter Weather Operations solution to work with AVL systems or ArcGIS location tracking because these different real-time data sources can be standardized into a consistent output schema. Then, the information is collected to a feature layer, leveraging data retention options so that historical data does not build up indefinitely.
This collected vehicle data is summarized in various ways using a scheduled big data analytic. Big data analytics perform pattern and summary analysis on large volumes of stored data. This analytic constructs tracks from the vehicle positions to summarize distance traveled, summarizes the amount of material deployed within the active winter event, and updates the status of the snow routes in terms of when they were last serviced.
These datasets are then queried dynamically by the Active Event Dashboard, providing operations managers key insights into the progress of storm clean-up activities to ensure service agreements and key performance metrics are being met.
Stakeholder transparency into response status
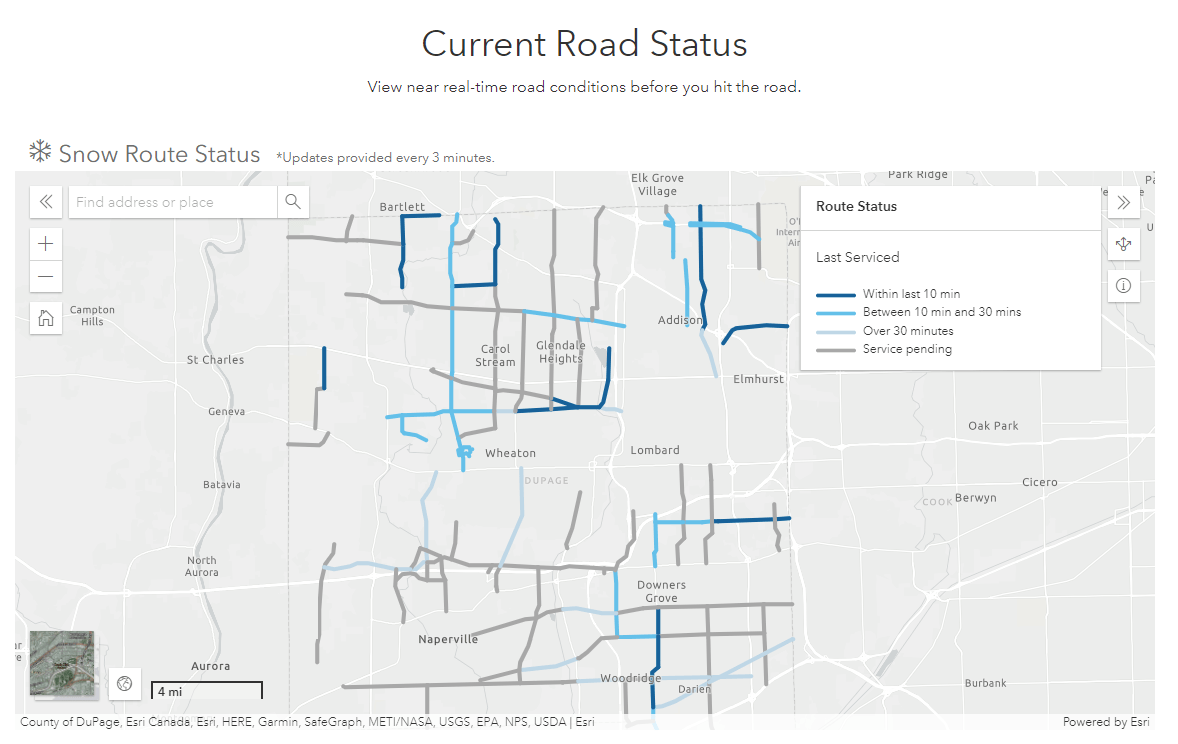
Another extremely important dimension of winter response activities is public outreach and communicating route status during a winter storm. The snow routes data, regularly updated by the big data analytic, enables public works departments and road commissions to provide transparency to their citizens and keep them informed on which roads are safe. The Snow Route Status app, part of the related Winter Weather Outreach solution, visualizes this information in terms of when a particular road segment was last serviced, and if service is still pending.
This not only promotes public safety but also helps reduce unnecessary calls for service by proactively sharing which roads are already planned for imminent response work.
Finally, in addition to awareness of current storm operational status, department directors need to be able to review response activities over the course of a season and assess budget needs for the future. The Winter Season Dashboard provides a window into performance, event by event, breaking down vehicle activity, distance traveled, material used, and service requests.
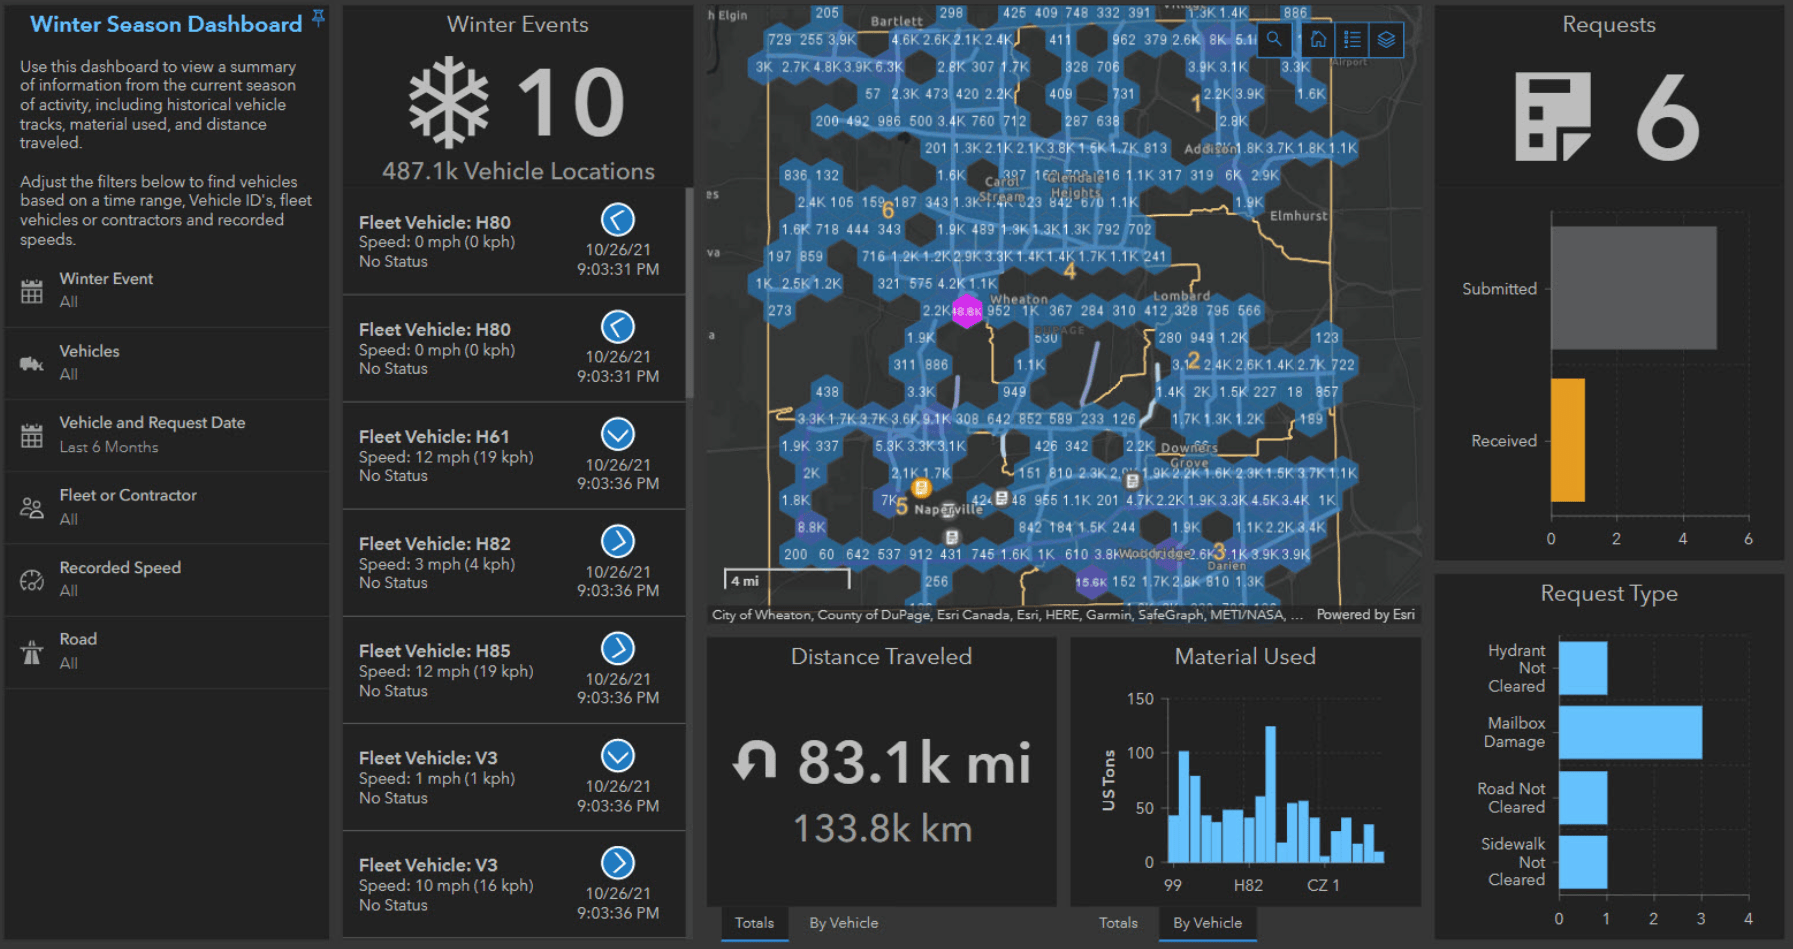
This comprehensive view is also powered by the vehicle history data and the summary information products generated by the hosted analytics in ArcGIS Velocity. As a result, this dashboard enables directors to investigate vehicle activity relative to citizen requests and complaints, understand quantity of deployed material, and measure overall effectiveness of season operations for long-term planning.
Summary
Today, local government agencies spend billions of dollars on snow & ice response and removal annually, and with winter storms becoming more frequent in many regions, operations and maintenance budgets run the risk of growing unsustainably. Leveraging and collecting real-time data on snowplow and material deployment operations are critical to optimizing storm response efforts. Configurable feeds and analytics in ArcGIS Velocity serve as an engine to these kinds of tasks, enabling effective operational monitoring and situational awareness, which is essential to reduce costs, promote public safety, and plan for what comes next.


Article Discussion: