It’s no secret that GIS is a powerful tool for mapping quantifiable data – numeric values, discrete categories, measurements, and more. But did you know that there are many ways to map more qualitative data as well? Unlike a tabular dataset of rows and columns, qualitative data usually takes the form of words. Common data collection methods here include in-depth interviews, focus groups, open-ended surveys, and field notes from observational studies. These methods allow for exploring complexities in peoples’ behaviors, attitudes, and concerns. This blog will highlight a few projects in which we’ve mapped quotes, stories, sentiments, and experiences with such data.
Use Labels in Web Maps to Display Quotes
Let’s start simple: displaying a quote next to a location on the map. This works best when the quotes are short, and very closely tied to a location.
During a series of in-depth interviews of electric vehicle drivers, I asked and mapped where people charge their cars. But furthermore, we asked a bunch of contextual questions: what is the parking situation there, how long they usually stay there, and so on. After the interviews were complete, I went through the transcripts and extracted excerpts / quotes that I wanted to display in the map. I was able to add a field to the feature layer of their charging points, and I added the quotes as string values in that new field. This set me up to configure labels in Map Viewer within ArcGIS Online.
![Two points on a map of streets. One has a label next to it saying, "Yeah, there was almost always a spot open. I don't even know if I ever couldn't charge." The other one says, "And then the ones at Sprouts came in and I was like Woohoo. I charge all the time at Sprouts now. [Although] actually for a little bit, they weren't turned on."](https://www.esri.com/arcgis-blog/app/uploads/2023/11/transcript_snippets_as_labels.jpg "Two points on a map of streets. One has a label next to it saying, \"Yeah, there was almost always a spot open. I don't even know if I ever couldn't charge.\" The other one says, \"And then the ones at Sprouts came in and I was like Woohoo. I charge all the time at Sprouts now. [Although] actually for a little bit, they weren't turned on.\"")
This approach can be tied to many topics that lend themselves well to displaying contextual quotes around multiple points on a map. Imagine mapping grocery shopping locations among people who are food insecure, or health care visits among people who have chronic conditions. A single person is interacting with multiple locations – EV chargers, a mix of grocery or convenience stores, or a mix of clinics, hospitals, and pharmacies. This person likely has a different sentiment about each of the locations they are visiting. Sentiments can be displayed on the map as labels, but only when the quotes are relatively short.
Use Pop-ups to Put Experiences on the Map
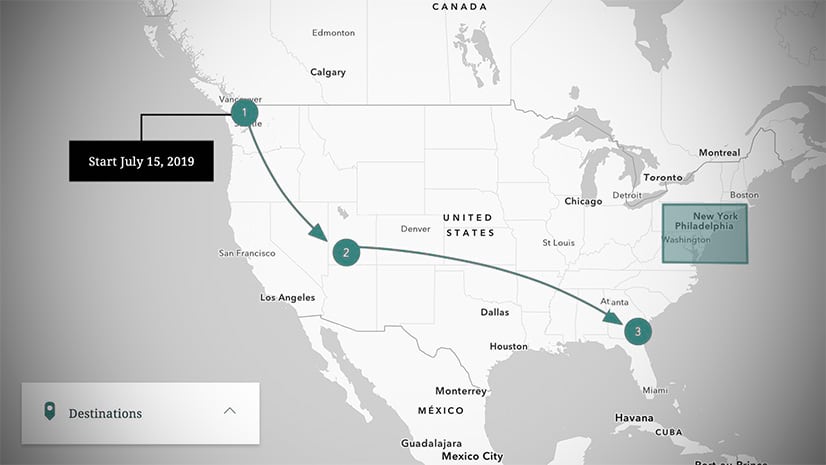
In order to preserve an entire story or experience tied to one location, try configuring a pop-up to display that experience. Pop-ups allow people interacting with the map to learn more about a location with one click. ArcGIS Online allows for highly customizable pop-up configurations, and even ArcGIS StoryMaps’ Express Maps allow for simple pop-ups. ArcGIS StoryMaps is integrated with web maps in ArcGIS online, however there are times when storytellers want to create a simple map for use only in a particular story. Express Maps fills this need, allowing storytellers to put dots, lines, arrows, and more on a map.
In this example, an Express Map was configured to map longer stories and experiences that surfaced through the EV charging interviews. These experiences were too long to include as labels, and were often tied to only one location. We wanted a way to show these experiences in full, without reducing them down to excerpts or snippets.
. Map shows three points with long pop-ups: one about a close call in Gorman, CA going over the Grapevine, one in Santa's Village, CA in the San Bernardino Mountains, and one in Cabazon, CA returning from a camping trip in Joshua Tree National Park.")
These longer text-based pop-ups can be configured in ArcGIS Online, ArcGIS Pro, ArcGIS Enterprise, and even in ArcGIS StoryMaps through Express Maps.
Use ArcGIS Dashboards to Show Differences Across Space, Time, and Groups
Perhaps your data is shorter in terms of text (words and phrases rather than full sentences or stories), and what you’re interested in showing is the geographic differences or social differences within the data. ArcGIS Dashboards can be a great way to display this type of information.
Participants in the National Geographic Explorers Festival filled out an ArcGIS Survey123 form before, during, and after the event. Those responses were mapped, charted, and visualized in a dashboard. The colors used to symbolize the points evoked the emotion being mapped, such as red for angry and blue for calm. And the specific words used by the respondents are displayed as labels on the map. The responses not only provide a snapshot of participants’ emotions, but also the geographical context adds another layer of richness to our understanding.

Additionally, anyone interacting with this dashboard can filter the responses by clicking on bars or slices of the charts, and the map updates to display only those responses. For example, clicking on male or female in the pie chart here changes all other charts and maps to only show sentiments from those respondents. This can help to illuminate the different sentiments or feelings held by different groups.
Present Word Clouds in Pairs to Reveal Differences Between Groups
Word clouds are visualizations of text that show the more frequent words in larger fonts, and less frequent words in smaller fonts. The result is that more salient words “pop.” ArcGIS Survey123 generates word clouds for text-based questions in your forms. You can highlight differing sentiments or opinions held by different groups by presenting two word clouds side-by-side. One for males, one for females. Or one for owners, one for renters. Stratify your survey results by something that makes sense for your project.
For instance, we asked survey respondents, “How you would describe the Inland Empire?” using an open text question. Next, we used a single selection (radio button) question to ask people whether or not they believe they live in “the Inland Empire” – a nebulous place in Southern California generally in between Los Angeles and Palm Springs named for its historical citrus empire.
. Do you live in the Inland Empire? (radio-button/single-choice question with the options Yes, No, and Unsure).")
By default, Survey123 generates a word cloud for open text questions once there are at least 20 responses. Click the Analyze tab within Survey123 to see this word cloud.

However, it’s simple to filter these responses and see new word clouds generate. Simply filter the responses by any of the questions in your survey within the left panel. In this case, we filtered based on the single selection question of whether or not the respondents self-identified as living in the Inland Empire. (Note that you need to have at least 20 responses in each group in order to generate a word cloud for that group.) Use the Print current view option to generate a static image to use in reports or slide decks. You can also edit the responses in the Data tab to adjust spelling and punctuation.


By presenting the two word clouds together, the differences are evident. We see that the sentiments about the Inland Empire differ between those who do self-identify as living there and those who do not.
Many Options
Labels, Pop-ups, Dashboards, Word Clouds. So many possibilities. How will you experiment with mapping quotes, stories, sentiments, and experiences? We’d love to hear about your work in the Esri Community.


Article Discussion: