In ArcGIS Business Analyst, the Suitability Analysis workflow allows you to identify the sites most suitable for your needs by evaluating them according to a set of individually weighted criteria. There are three steps to perform a suitability analysis: select your sites, select criteria for your analysis, and view the results. When selecting criteria, you can use data variables from Esri’s ArcGIS Living Atlas of the World, as well as your site attributes. This article will use a scenario to illustrate in detail how suitability scores are calculated. For detailed information on other steps in the workflow, see Perform a suitability analysis.
Imagine that you are a real estate agent helping Tom, a new client, buy a home. Tom is a professional with an advanced degree who is interested in neighborhoods occupied by people with similar demographics to himself. Additionally, Tom’s 83-year-old father lives with him and relies on being in close proximity to a senior center for socializing. Tom and his father want a home in a neighborhood within walking distance to a well-reviewed senior center. You need to present him with a neighborhood analysis for each senior center location, evaluating the neighborhood’s suitability based on Tom’s criteria:
- Greater number of individuals with graduate or professional degrees, which is your client’s profile
- Lower median home value, indicating greater home-buying affordability
- A median age close to his own (39)
Select the criteria
In the Suitability Analysis workflow, you select the five best senior centers according to Tom’s father and create a 0.75-mile radius around each. You name these five sites Candidate 1, Candidate 2, Candidate 3, Candidate 4, and Candidate 5. Based on Tom’s criteria, you select the following three variables in the data browser:
- 2022 Population Age 25+: Grad/Professional Degree
- 2022 Median Home Value
- 2022 Median Age
Set the criteria influence and weight
To reflect the importance of the various criteria, refine the criteria settings as follows:
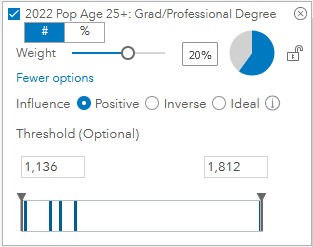
For Tom, living in a neighborhood with people who, like himself, have graduate or professional degrees is a “nice to have” but not critically important. You decide to weight the 2022 Pop Age 25+ Grad/Professional Degree variable at 20%.
For this criterion, a site with a higher number of individuals holding graduate and professional degrees is considered more suitable. This means the criterion’s influence is positive: more of the variable means it’s more suitable. You keep the Influence setting as Positive for this variable.

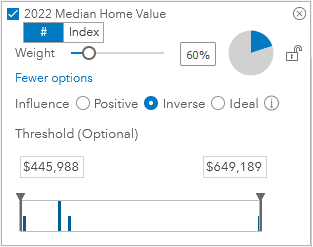
The most important factor in Tom’s decision to buy a house is home affordability, so you set the 2022 Median Home Value variable at a weight of 60%.
For median home value, a lower value is more desirable as it is indicative of greater home affordability. Therefore, you change the Influence setting to Inverse. An inverse influence means that the lower the variable’s value, the more suitable the site is considered.

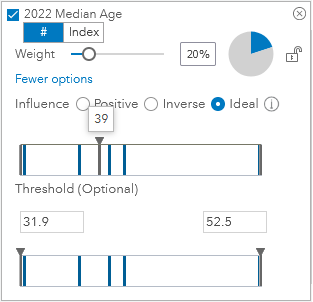
Tom thinks it would be nice to live in a neighborhood with people around his own age, but it’s not the most important factor that will go into this decision. You set the weight for the 2022 Median Age variable at 20%.
For median age, the closer the value is to your client’s own age (39), the more suitable the site. Setting a specific value and scoring sites based on how close the variable value is to the specified value is known as ideal influence. Therefore, the Influence setting is set to Ideal and the ideal value specified is 39.

View the analysis results
After the criteria have been set for the analysis, the Suitability Analysis Results table displays the suitability scores for each site. By default, the table ranks the sites in the order of most suitable to least suitable and the results are color-coded on the map.

In this table, you can see that Candidate 5 is the most suitable site, with a score of 0.97. But how was this calculation reached?
Understand suitability score calculations
The weighted score for each criterion is calculated as a percent difference of the value for a given site compared to the target value selected. Let us understand in detail how the weighted scores and final score are calculated, using the values for site Candidate 3 in the above table as an example. For brevity, we’ll use the abbreviation GP for the Grad/Professional Degree variable, HV the Median Home Value variable, and MA for the Median Age variable.
First, we’ll walk through how the weighted score for Grad/Professional Degree (GP) was calculated. For this criteria:
- Candidate 3 has 1,232 households with a graduate or professional degree.
- The maximum value for GP across all the sites is 1,812 households (for the site Candidate 5).
- The minimum value for GP across all the sites is 1,136 households (for the site Candidate 4).
- The weight specified for GP is 0.20.
- You selected positive influence for GP.
The weighted score for a variable with positive influence is calculated using the following formula:

Plugging these values into the formula, the GP weighted score for Candidate 3 is calculated as:

Next, let’s see how the weighted score was calculated for the Median Home Value (HV) of the site Candidate 3:
- Candidate 3 has a 2022 Median Home Value of $473,469.
- The maximum HV across all the sites is $649,189 (for Candidate 4).
- The minimum HV across all the sites is $445,988 (for Candidate 5).
- The weight specified for HV is 0.60.
- You selected inverse influence for HV.
The weighted score for a variable with inverse influence is calculated using the following formula:

Plugging these values into the formula, the HV weighted score for Candidate 3 is calculated as:

Next, let us see how the weighted score was calculated for the Median Age (MA) of the site Candidate 3:
- Candidate 3 has a MA value of 39.1.
- The maximum MA across all sites is 52.5 (for Candidate 4).
- The minimum MA across all sites is 31.9 (for Candidate 2).
- The ideal value specified for MA is 39.
- The weight specified for MA is 0.20.
The weighted score for a variable with ideal influence is calculated using the following formula:

Plugging these values into the formula, the MA weighted score for Candidate 3 is calculated as:

Understand the final site score
The final score for a site is the sum of the site’s weighted scores for all the criteria. For Candidate 3, using the weighted scores we calculated above, the final score is calculated as:
0.03 + 0.52 + 0.20 = 0.75
The final score for Candidate 3 in the table is 0.74, which is slightly lower than our calculation above. That is due to rounding of the weighted score values displayed in the table.
Hopefully, the scenario used in this article helped you understand how criteria influence, weights and values are used in Suitability Analysis to calculate a site’s final score. Thank you for reading! Please comment or reach out if you have any questions.

Article Discussion: