It might seem strange to be doing an analysis on something that doesn’t exist, but the Void Analysis workflow in Business Analyst does just that. By comparing locations of a business or category in a reference area to those in the area you are interested in, it provides a detailed analysis of what is missing or “void”.
In the March 2022 release of the software, we overhauled this powerful analysis workflow based on your feedback to make it easier, more progressive and more focused on the voids themselves. Getting a clearer understanding of these voids can help you better assess the business and service needs of a given location and strategically plan for new businesses or services in the area of interest.

Simplifying the setup
Let’s have a closer look at the simplified setup by following a real-world use case for the analysis. This example takes place in the US, but the analysis will work on any other country with Business / POI data.
Imagine that you are trying to find a new tenant for a recently vacated store in a commercial area in North Houston. You would like to pitch the location to several clothing and retail brands that don’t currently have stores in the area. To help the decision makers better understand the opportunity, you want to run a Void Analysis for the area around the vacant location. If the results show that there is ample market space, this could be a good fit for one of those businesses.
The first time you select an analysis area in the updated workflow, you will see the dialog box below which allows you to define how the reference area will be chosen. Once you have made your selection in this window, your setting becomes the default: you won’t have to choose the reference area each time you run the analysis. With a single click, both areas will be chosen.

By default, the dialog is set to create an area that is two times bigger than the analysis area. This setting has been chosen to accommodate the widest range of potential analysis areas, but you can always change it to fit your needs. You can also choose to expand the analysis area by a fixed time or distance, compare it to the nearest standard geography (like a county or ZIP code) or allow for manual selection each time through.
In the current example, I have entered a drivetime area around W 20th Ave in North Houston as my area of analysis. By clicking OK, I confirm that for this and future passes through the workflow the software will automatically create the reference area by expanding the analysis area by a factor of 2. If I ever need to change this setting, I can always open this window by clicking on the Change reference area link below the reference area or by going to the Void Analysis settings in the application preferences.

Simplifying the choice of voids
As in other workflows, we have made selecting the actual search categories much easier in this release. To run the analysis, you can simply click on one of the preconfigured lists to get results. For example, with one click, you can now explore voids for Restaurants, Big Box, Retail, Clothing, Financial and Healthcare categories.
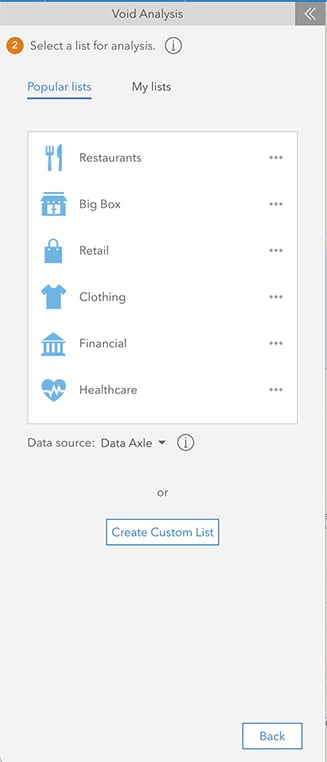
You can also create your own lists by clicking the Create Custom List button at the bottom, choosing the relevant categories, assigning a list name and choosing an icon. This custom list will appear below My Lists and allow you to repeat the same analysis on a different area with a single click. Note that you can also specify which data source you would like to use with the Data source drop-down menu located below the lists when the country you are searching in has multiple data sources.
Creating your own list
In our case, let’s create a custom list for clothing and retail. Once I have added my categories in the window below, I can either run the analysis right away by clicking the Run Analysis button or I can save the custom list for future use on other areas by clicking Save List.

I would like to use this list again, so I will click Save List. In the next window you will notice that the categories are reiterated at the top. Next, I will give the list a name and choose an appropriate symbol to represent it in the My lists tab.

I will now click Save and Run Analysis. Not only will I see my results immediately, but I will have this list saved for future use.
Focusing on the voids
The first tier of information that the workflow returns, in addition to the points on the map, is the View results panel providing a quick summary of the locations found and the resulting voids. To the right of the category icon and drop-down menu is the total number of voids. In this case, there are 81. Note that you can use the category drop-down menu to focus in on just a subcategory of your analysis, if there is one.
Below the total number of voids, you will see a breakdown of the locations found. There are 52 locations within the analysis area and 139 in both the analysis and reference areas. The results panel also includes a legend for the symbols that appear on the map in each of these groups.
Let’s dig a little deeper into these voids by clicking the Full Results button at the bottom of the panel (you can also use the expand table tab to the right of the summary). Now you will see the full list of voids returned by the workflow for your chosen analysis area.
This summarized view of the voids was by far the most requested table view from user feedback. At the left are the names of the businesses for which there are voids. The first column shows that there are in fact voids for this business in the analysis area. The second column shows how far away the nearest business is located from the starting location and in what direction. Finally, the last column shows the number of each business found in the reference area. It is easy to export this table to Excel or PDF by clicking the Export button at any time.

In this default view, you can learn more details about the nearest location to the void by clicking on the expand arrow to the left of the business name to show address, the NAICS and SIC code and number of employees.
You can also simplify this void-only view by checking the Show categories only checkbox below the category drop-down menu. In our example below, notice the light red color of the category row near the bottom. This indicates a void for that category (you can always change the default color of the rows by clicking the Table settings button at the top right of the table). It is clear that in addition to contacting stores like Ann Taylor and Marshalls and Old Navy, I might also want to focus in on men’s clothing brands since they represent an entire category that is void in the area of interest.

Revealing the Advanced view
But what if I want more information still? Or what if my reference area doesn’t overlap my analysis area and I would like to normalize the results by population? Such a use case could occur if I were comparing two otherwise similar areas in separate towns or states. For all that and more, try the advanced view of the results by clicking on the Advanced view toggle at the top right of the table.
Now, the most detailed view of the analysis results is on display. In the drop-down menu at the top left of the table you will note that by default the two areas have been normalized by Population, but you can also choose to normalize the results by another popular variable, one from the data browser, or turn it off entirely.
Once the results are normalized, you can choose to add the density column to the table by clicking on the Display density column in advanced view checkbox in the settings window. This value expresses a ratio between the number of business locations and the number of the normalized variable served. By default, it provides a relationship between business locations and number of people in the area. You can drag your cursor over the numbers in the results table header to reveal a detailed tooltip of how these values are derived.

It is important to recognize that in the advanced view, unless it has been filtered, you will likely also see businesses that represent gaps, balances or even surpluses in the analysis area. This extra information will certainly help you clarify the business opportunities in the given area.
Concluding the analysis
Before we started this analysis, we weren’t sure what businesses would be good candidates for our vacant location in North Houston. But as we quickly teased out in this example, the results point to a noticeable void of men’s apparel in our area of interest. Therefore, it makes sense to present the vacant location to a men’s apparel brand as well as to other brands showing voids in the area.
We hope you will find the updated version of the Void Analysis workflow useful in helping you better serve locations and areas that require thoughtful business development. We have prepared a video of the workflow in action for you to follow along and learn more. As always, we look forward to your feedback on this powerful tool.

Article Discussion: