The Business Analyst web app has been updated!
This release has four main areas of focus:
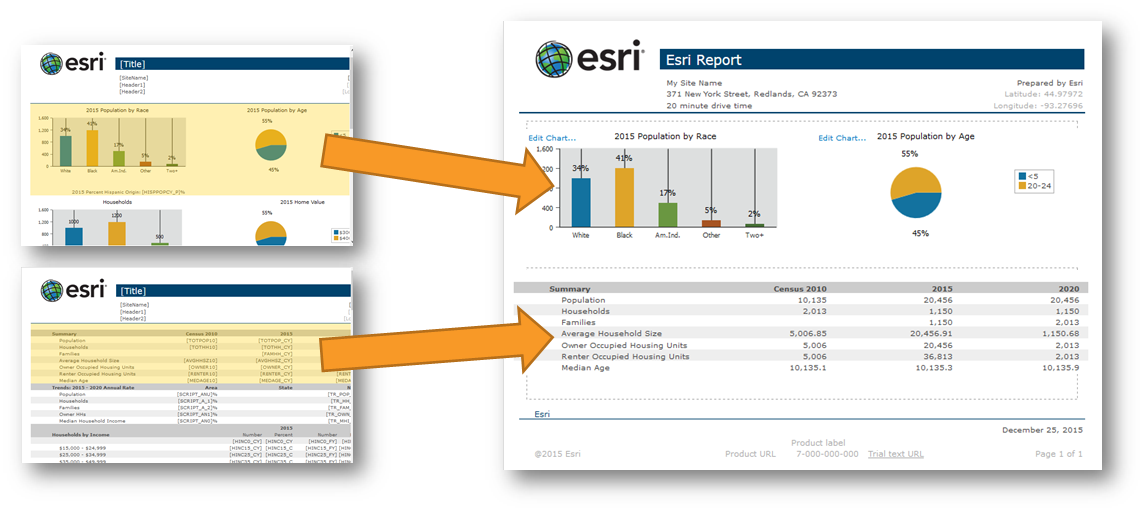
Build Your Own Custom Reports
Reduce pages of reports to just the data variables you need. Choose whole sections from reports or just add specific variables. Turn those variables into percentages or charts. Reports can be shared with your organization and used in the web, mobile, or desktop applications. Learn more about this exciting new feature and Get Started with Custom Reports!
Access Updated Demographic Data for 60 Countries
The Standard Global Demographic data from Michael Bauer Research was updated. 11 countries now have a new lower level of geography available and 48 countries have new updated content. You can read more about these updates in What’s New in Esri Demographics (March 2016).
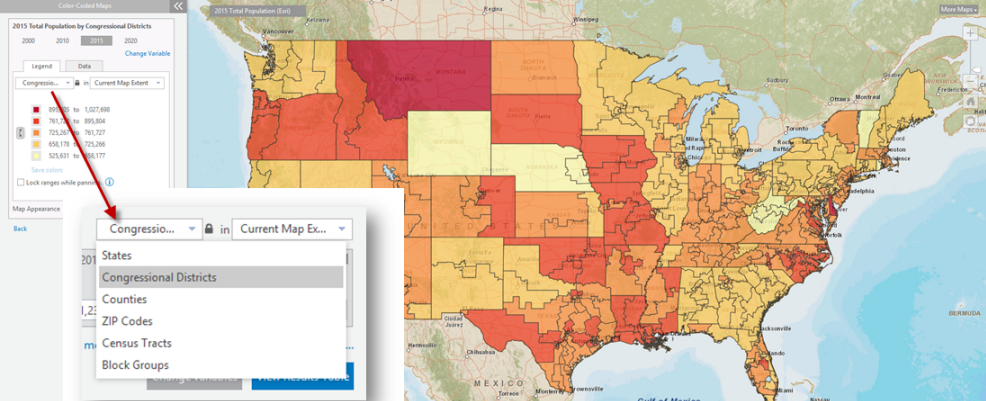
Map with Congressional Districts
Just in time for the election! Now you can create color-coded maps and use Smart Map Search with congressional district boundaries.
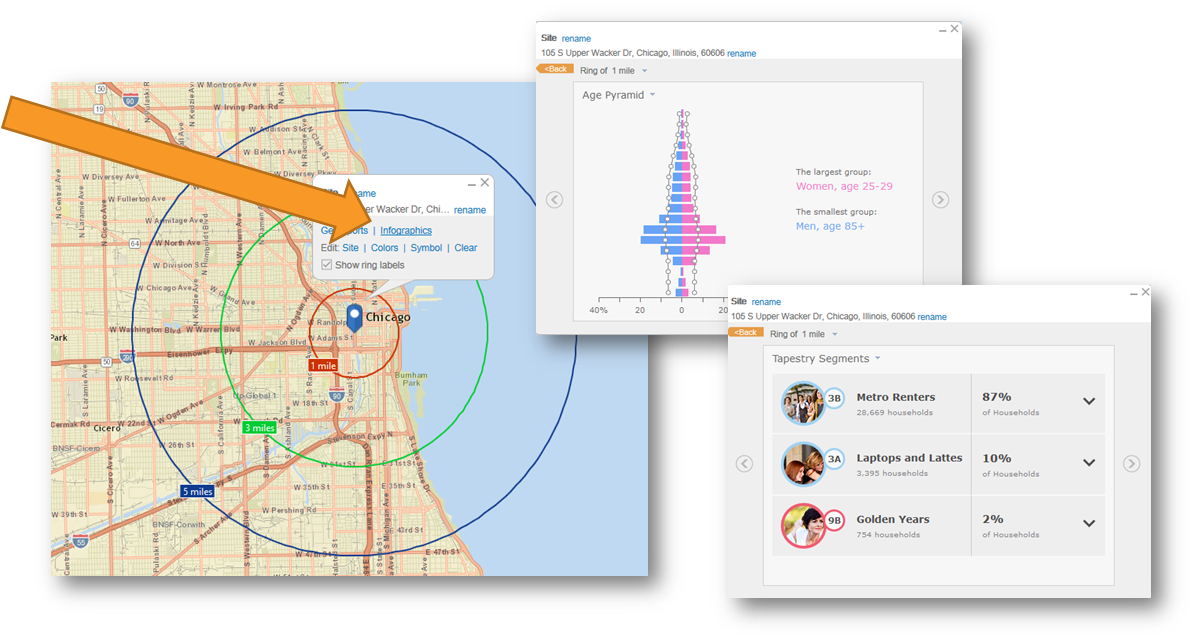
Understand Sites with Infographics
Infographics, as seen elsewhere in Esri products, are now available in Business Analyst. Get a quick demographic snapshot of a site.
You can read more about what’s new in the help documentation.

Article Discussion: