Customization is a developer’s superpower. A simple modification of a basemap layer or tile can shape how users think spatially, analyze geographical information, and ultimately make decisions. In a world where crossed lines on a map often signifies ‘lines crossed’ in the real-world, what developers map, and the context they provide to users becomes increasingly crucial.
ArcGIS Basemap Styles (v2) has been designed to enhance the way developers tell stories with basemaps. With the introduction of two exciting new features, Basemap Places and Worldview, app creators now have greater control over their basemaps. This empowers them to offer more insightful location-based context and cater to diverse mapping, analysis, and decision support needs.
A Closer Look at the New Features
Basemap Places
With Basemap Places, you can effortlessly control the presentation and interaction of Places data within your basemaps. This feature unlocks a world of possibilities, including:
- Extended Geo-spatial Insights: You can choose to show or hide places in your basemaps, providing users with valuable location-based context for areas worldwide.


- Curated Maps and Apps: By filtering a subset of places based on selected categories like “Food and drink,” “Lodging,” or “Transportation,” you can create curated maps and apps. This allows you to tailor your maps to specific user needs and preferences.
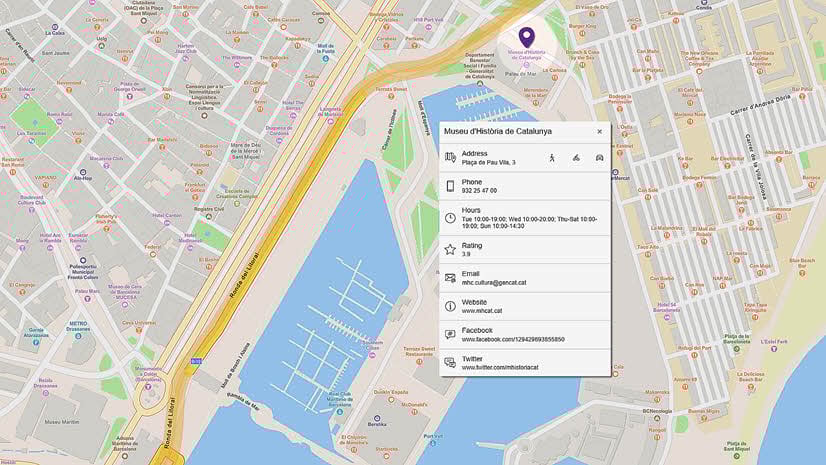
- Enhanced Interactivity: Basemap Places introduces new levels of interactivity with Esri’s basemaps. Users can now obtain additional details about a place by simply clicking on points of interest (POI) features within the basemaps. Imagine accessing rich attributes such as street addresses, ride share drop-off locations, business hours, user ratings, and more, all supported by the new ArcGIS Places service.

Worldview
Worldview is an innovative feature that puts you in control of how international boundaries are displayed. In the Esri vector basemaps, recognized international boundaries like the Norway-Sweden border are typically represented with “solid” lines, while disputed boundaries such as parts of French Guiana and the Suriname border are often displayed as “dashed” lines.
With Worldview, developers can adjust the presentation of boundary lines based on user preferences. By providing an enumeration value or an array of values, they can create a world view of boundaries. Boundaries are a fundamental element of basemap styles and play a crucial role in customizing the display of maps. Developers can choose which dashed lines to retain, offering map viewers a more tailored experience.
On the map below, the orange and purple boundary lines can be adjusted to the right side of the disputed area, and users can decide which dashed lines to retain.

The introduction of the two new features in Basemap Styles service (v2) provides heightened control and greater flexibility for developers.
Learn more about Basemap Styles service (v2)


Article Discussion: