On April 1st, 2020 the decennial census will attempt to “count everyone once, only once, and in the right place.” Much is at stake in terms of divvying up federal dollars and political clout. States that are on the cusp of gaining or losing one of the 435 House of Representative seats are paying particular attention to the count, with many forming Complete Count Committees to ensure they have the most accurate count possible. In anticipation of Census 2020, Esri’s 2019 Time Series population estimates are used to forecast the winners and losers in the next round of reapportionment. We extend the analysis to explore some potential reapportionment scenarios based on changes in statehood for Puerto Rico and the District of Columbia (DC).
While the concept of equal representation sounds simple on the surface, fair apportionment is a mathematical challenge. Although much attention is centered on redistricting within states, where geography defines politics, the formula to allocate the 435 seats among the states is equally intriguing. Historically, there have been five methods of apportionment, but the current Method of Equal Proportions has remained in place since 1941. The number of congressional seats was set to 435 by the Permanent Apportionment Act of 1929 and guarantees each state at least one seat. After the first 50 seats are assigned, the remaining 385 seats are distributed based on the state population values and this formula:

Essentially, this formula goes through the congressional seats one by one and allocates a seat to the state that has the largest population, weighted by the number of seats already given to them, in each stage. This process is conducted for every seat until all 385 are allocated to the 50 states. The District of Columbia and US territories are not factored into the calculations and do not receive seats based on the current apportionment process.
Esri Updated Demographics 2020 Reapportionment Projection
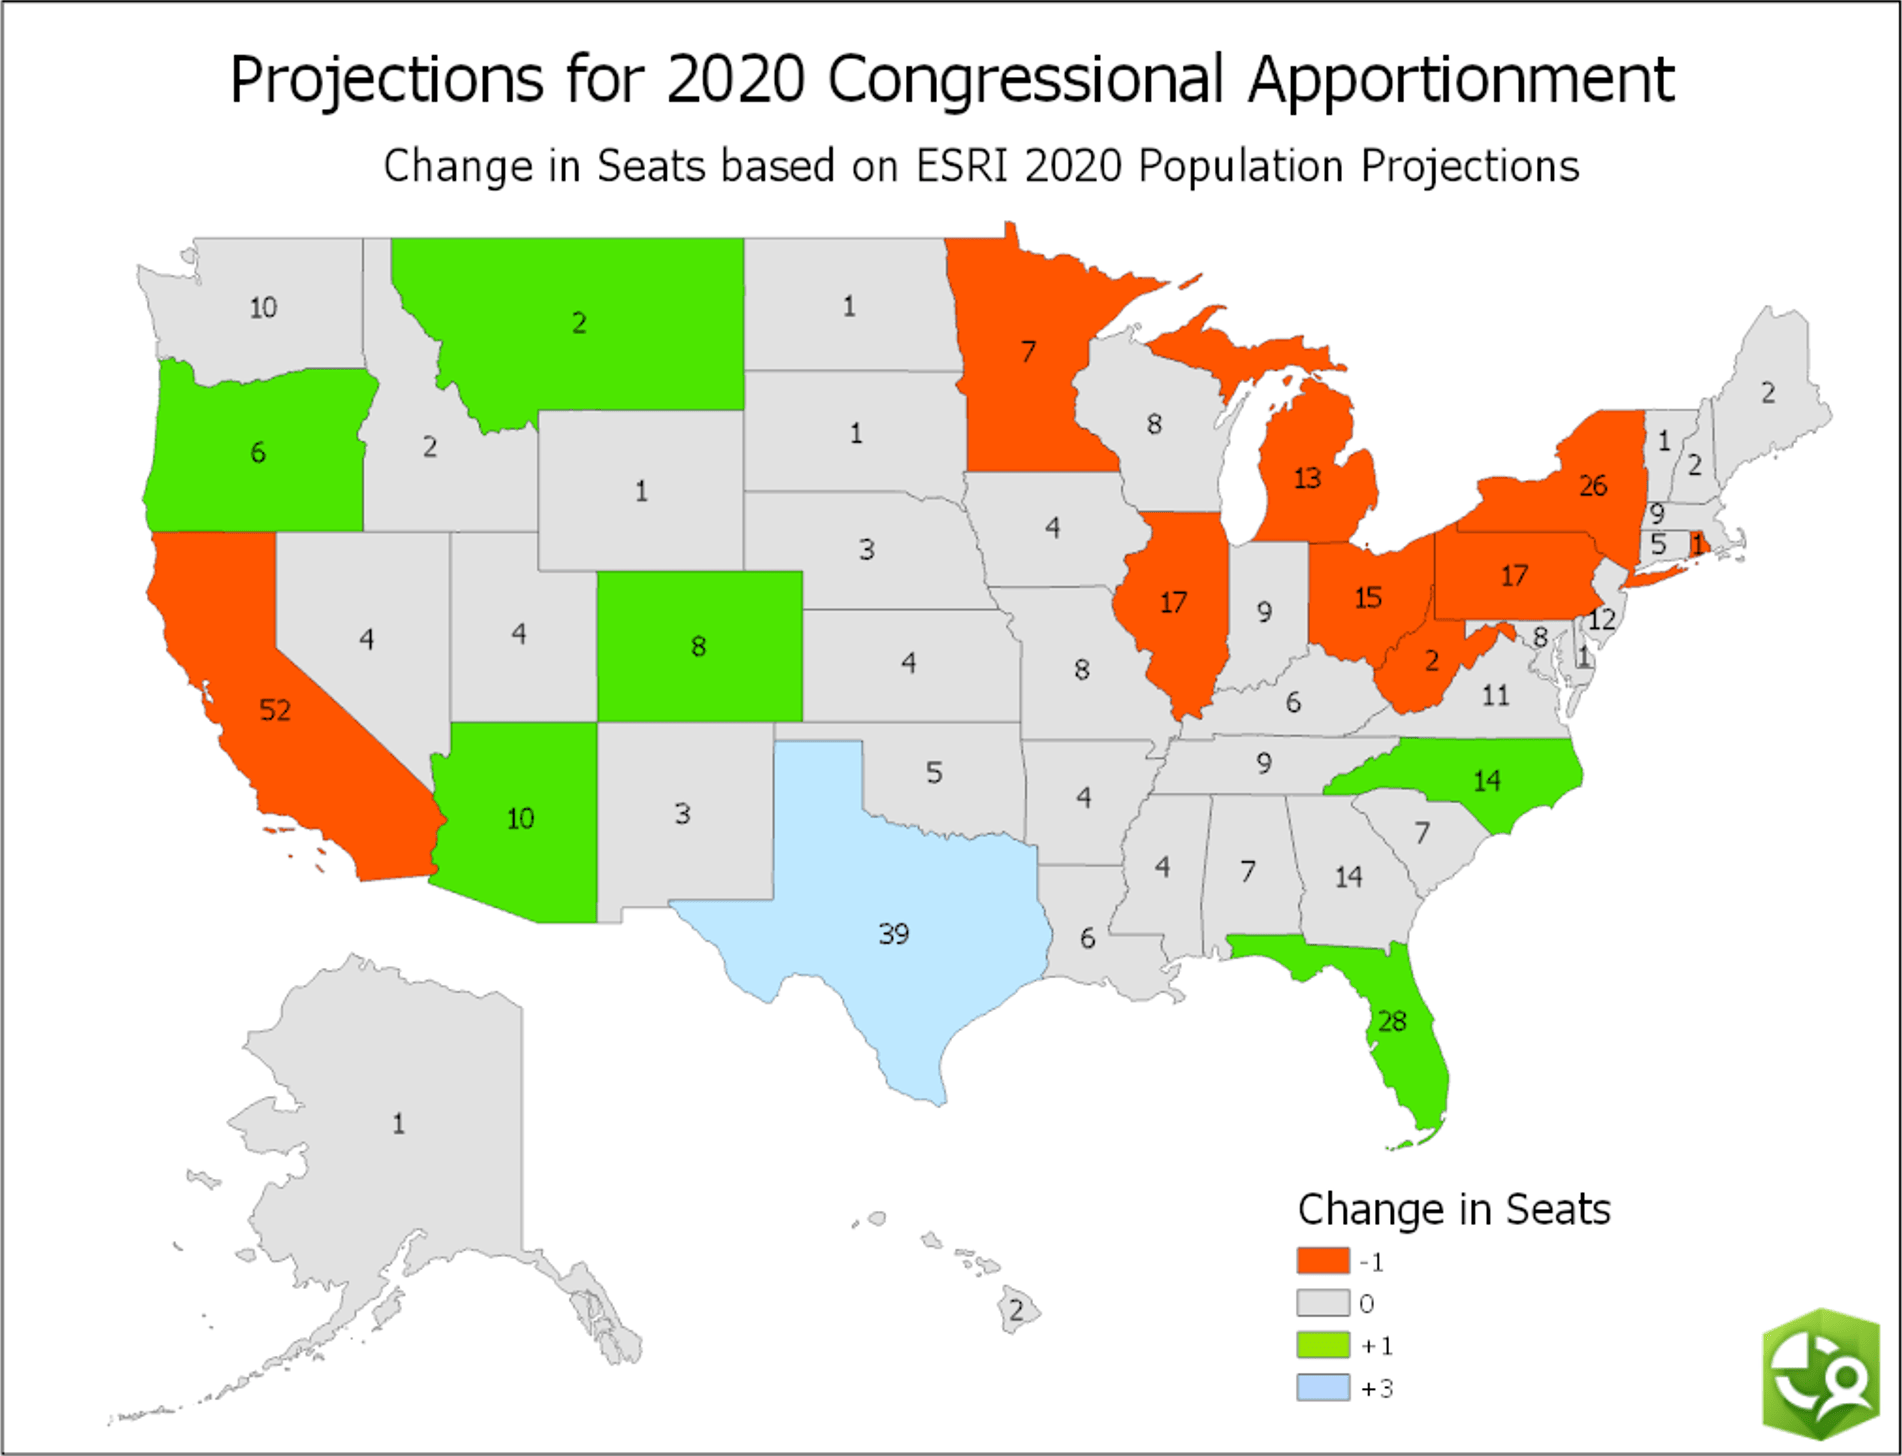
Esri’s state-level Time Series population values from the 2019 Updated Demographics are projected to 2020 and applied to the algorithm for congressional apportionment. Based on these calculations, it is estimated that, compared to the current seat apportionment determined by the 2010 Census, nine states will lose one seat, six states will gain one seat, and one state will gain three seats. The final five seats in the apportionment process (seats 431-435) are given to Texas, Arizona, California, Montana, and Alabama. These “bubble” states are at the highest risk to lose seats as a result of any differences between the population projections and the actual Census 2020 counts. On the other hand, the five states that are closest to gaining additional seats are Minnesota, West Virginia, Ohio, Rhode Island, and Florida (four of which are projected to lose a seat when compared to the current 2010 apportionment). Based on these projections this would be the first time since statehood that California would lose a congressional seat.
States Gaining Seats |
States Losing Seats |
| (+1) Arizona | (-1) California |
| (+1) Colorado | (-1) Illinois |
| (+1) Florida | (-1) Michigan |
| (+1) Montana | (-1) Minnesota |
| (+1) North Carolina | (-1) New York |
| (+1) Oregon | (-1) Ohio |
| (+3) Texas | (-1) Pennsylvania |
| (-1) Rhode Island | |
| (-1) West Virginia |
Projecting the Effect of Puerto Rico and District of Columbia Statehood on Congressional Reapportionment
As interesting “what-if” scenarios, the effects of Puerto Rico and DC statehood on congressional reapportionment are also considered. Legislation was recently introduced that would attempt to grant Puerto Rico statehood without the need for a referendum, although it has not yet been voted on by the House of Representatives or Senate. Like Puerto Rico, much has been written and discussed about the potential for granting statehood to the District of Columbia. DC voters themselves overwhelmingly supported a 2016 referendum to approve the proposal of statehood and a House committee is currently scheduled to hold a hearing on the topic for the first time in 25 years.
When Alaska and Hawaii were incorporated into the union, the total number of congressional seats was temporarily increased to 437, giving each of the new states one seat until the next Census collected accurate demographic information in these areas. For the purposes of this analysis, Puerto Rico and DC are assumed to be fully incorporated into the next congressional reapportionment process with no intermediate period before a Census count is collected.
For Puerto Rico, Vintage 2018 estimates from the Census Bureau are projected to 2020 using the same method as the Esri state population data and included into the reapportionment calculations along with Esri’s 2020 state population projections. The changes from the original 2020 projection as a result of the inclusion of Puerto Rico are illustrated in the map below.
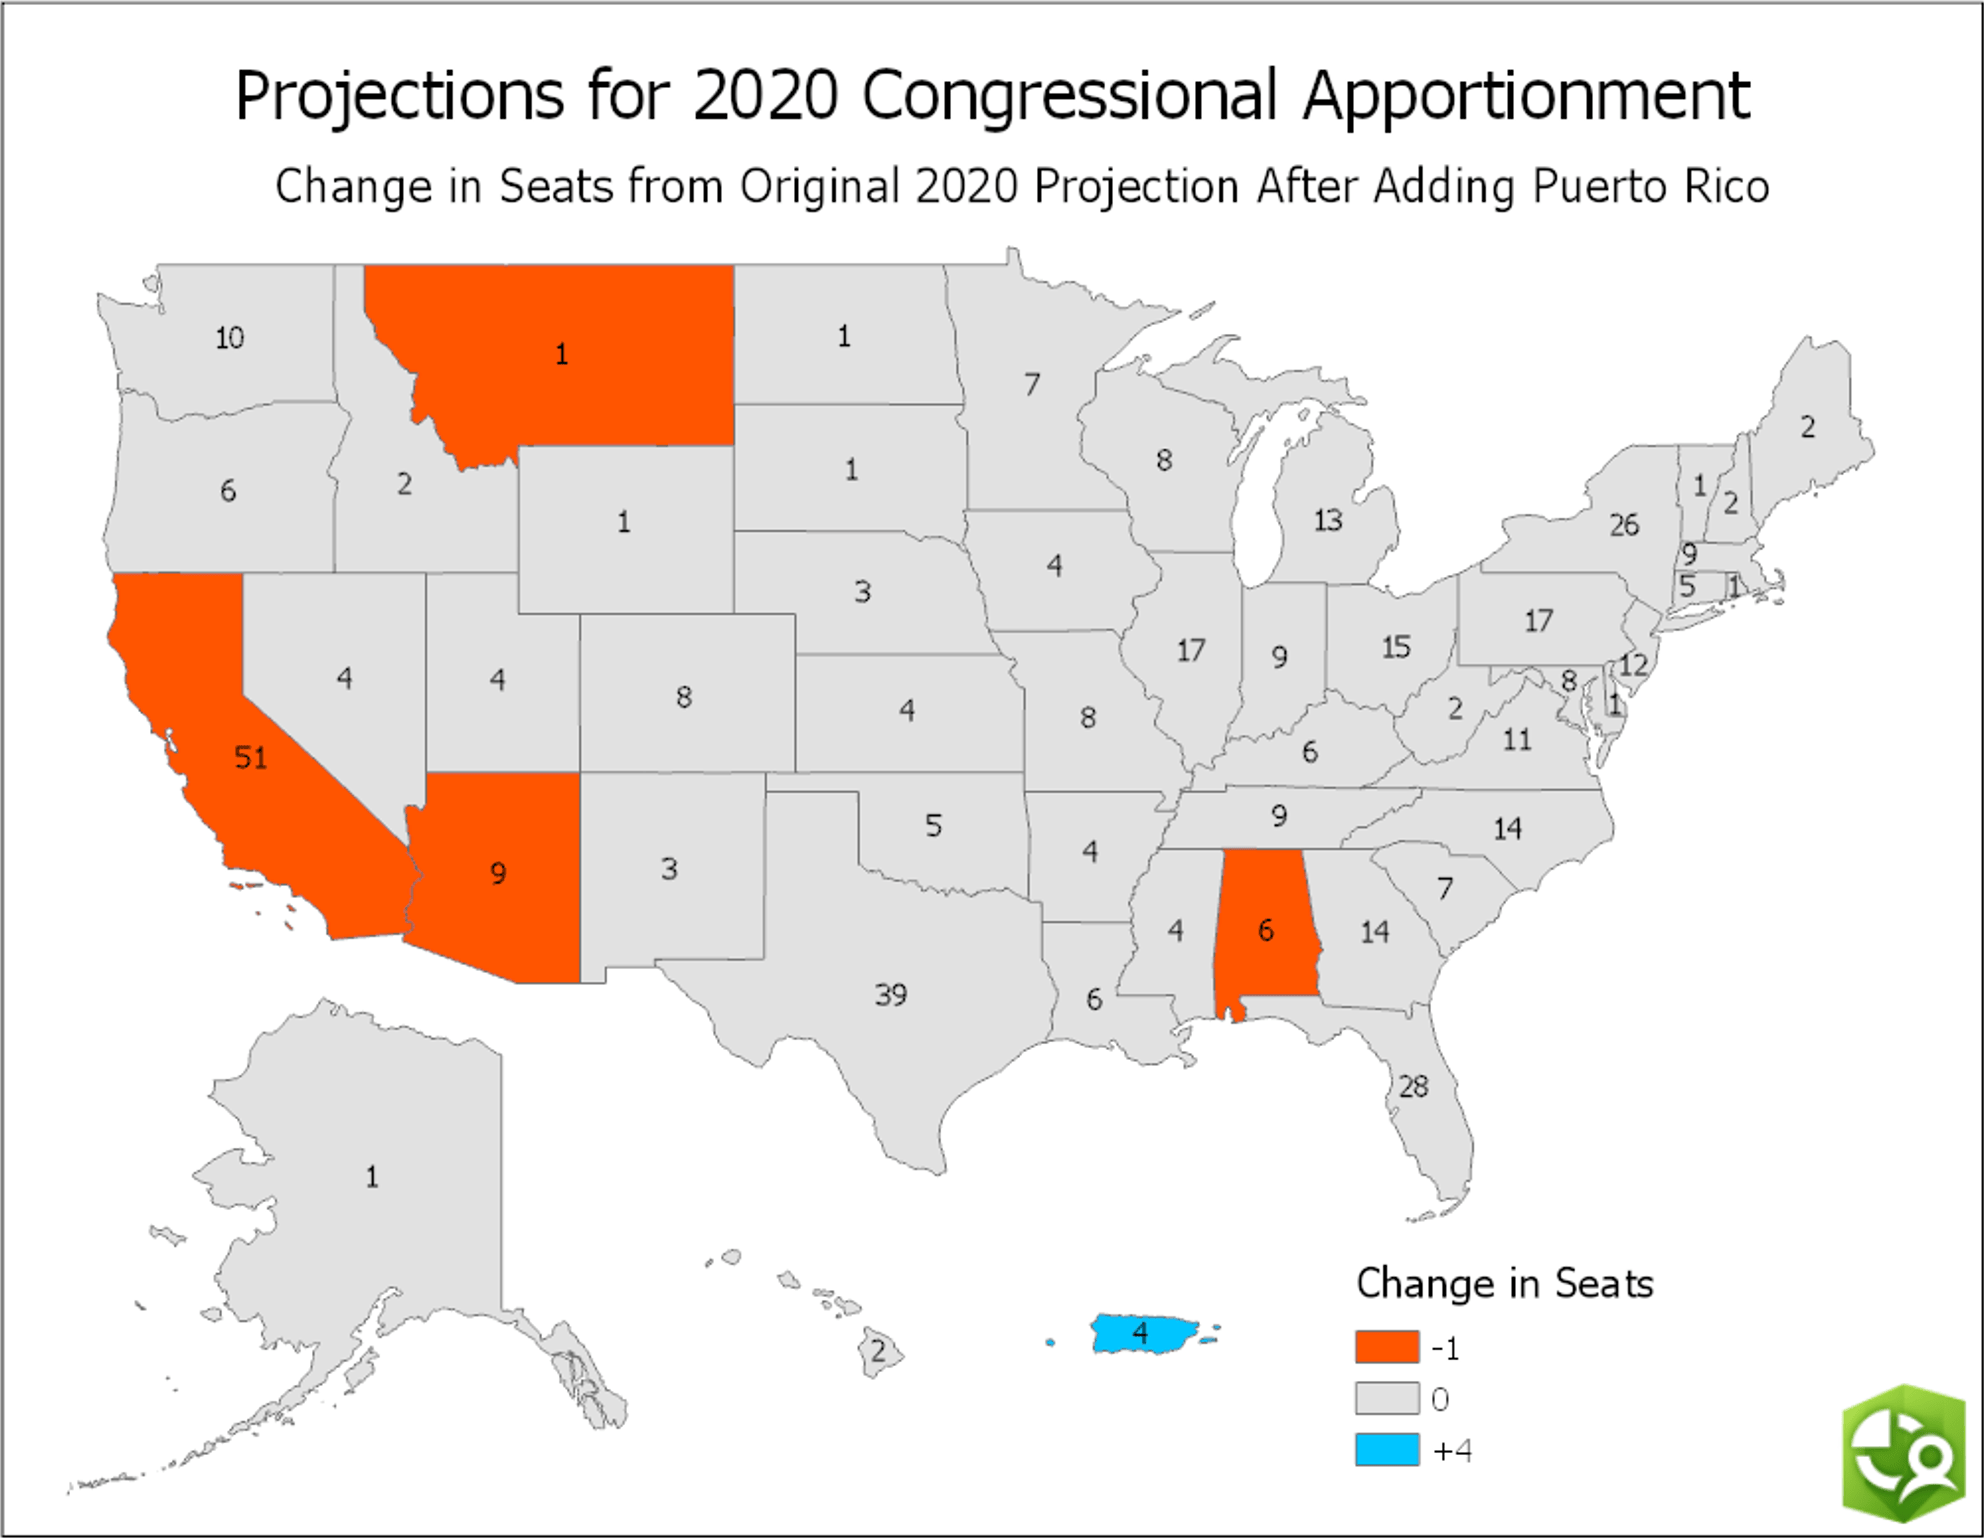
Based on Puerto Rico’s projected 2020 population of about 3 million people, the would-be state is allocated four seats. This, in turn, takes one seat away from Alabama, Arizona, California, and Montana. Note that these areas were included in the list of “bubble” states that are most vulnerable to losing seats. This increases California’s total seat loss to two when compared to the current apportionment.
Esri’s DC 2020 population projection of about 700,000 would make it the third smallest state, larger only than Wyoming and Vermont. This relatively small population reduces the impact of DC statehood on apportionment, resulting in DC being allocated only one seat and Alabama losing one seat. However, even a small apportionment change can have a large impact on the political landscape for the next decade.
Accessing the Esri 2020 Congressional Apportionment Projections and the Potential Impact of Statehood Changes story map will provide additional information on the apportionment projections and “what if” scenarios discussed in this blog. Click on a state to reveal specific details including a timeline of seat apportionment from 1910 to 2020.

Commenting is not enabled for this article.