Since its inception in 2009, ArcGIS for SharePoint has been steadily improving. The July 2021 release introduces you to a sleek, polished mapping interface and a new user experience that makes it faster and easier to add content from a variety of new enhancements and features.
You now have additional options to do more with your data, such as styling layers, Buffer/Drive time analysis, time animation, and refined infographics cards.
The ArcGIS add-in extends the document management and sharing capabilities of SharePoint, allowing you to create interactive and customizable maps. New capabilities in this release leverage location analytics, so you can understand how distance affects your driving time and schedules, and enrich your maps with demographic information to make informed decisions.
Welcome to ArcGIS for SharePoint–—yes, that’s the new name for the same impressive functionality, but with so much more!
A quick look at What’s New
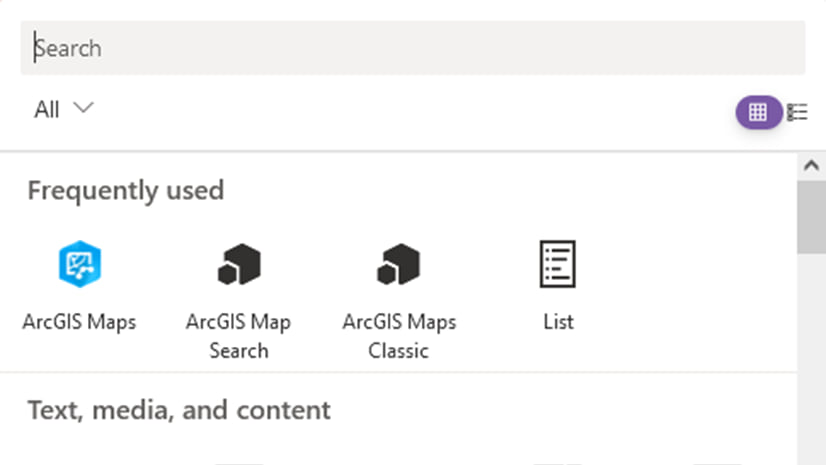
We are introducing a brand new webpart designed for modern SharePoint pages called ArcGIS Maps. Head over to our feature comparison topic that elaborates on what was, and what’s new.
Note: You still have access to ArcGIS Maps Classic (the previous version) as well as the ArcGIS Map Search app to enable geotagging.


After adding layers from SharePoint or ArcGIS, you can style them using smart mapping defaults. ArcGIS for SharePoint allows you to control the graphic elements, such as color ramps, line weights, transparency, and symbols. The July 2021 release introduces new and exciting styling options including additional color ramps and symbols. Experiment with the best way to represent your data.

Buffer/Drive time analysis
The new Buffer/Drive time analysis capability creates areas around input point, line, or polygon features based on a specified distance or travel mode. The results of the Buffer/Drive time analysis are saved as a layer in the map.

You can choose from different travel modes including walking, driving, and trucking.
Try using the Traffic check box, which allows you to factor either live or typical traffic into your travel time. You can even go granular by specifying travel direction toward or away from the location of your choice.
The results are then saved as a hosted feature layer in ArcGIS Online.

Time animation
If your dataset has date and time attributes, the Time button is available. Enable time animation to watch how your data changes over time. Use the time slider that appears as an animation control overlaid on the map, and define the time intervals shown.

Infographics cards
To provide context for your data, add infographics cards to the map. Infographics cards can be configured with a variety of demographic data including population, age distribution, and income levels, among others.
Each variable you select appears as a card on the map. Interact with infographics cards by selecting features on the map or zooming in or out. The card updates to reflect information for the map extent or the selected features.

Great functionality, with added enhancements to make maps even more powerful and useful via a Microsoft application—and it’s used by people everywhere who want quick, vivid, meaningful, and shareable infographics!
How to get it, product documentation, and Esri Community
The Get Started page guides you through the steps to set up and configure the new ArcGIS for SharePoint app. Get ArcGIS for SharePoint in via Microsoft AppSource.
To learn more about the product—such as system requirements, full descriptions of capabilities, and more—head over to the ArcGIS for SharePoint documentation site.
Read our blogs, interact with experts, take a survey, or just connect. Join us in the Esri Community to ask questions, share ideas, and let us know about your experiences with ArcGIS for SharePoint.


Article Discussion: