ArcGIS Excalibur is a web-based, imagery application that enables users to search for, discover, and work with imagery. It’s integrated directly into the ArcGIS System, meaning all collections, mensuration, and analysis is immediately available for dissemination and follow on geospatial analysis.
Excalibur is focused around two workflows: ad-hoc imagery discovery and exploitation and project-based tasking. In this blog, we’ll walk through how an analyst can utilize the ad-hoc workflow to monitor an area for anomalous activity, using the most recent available imagery.

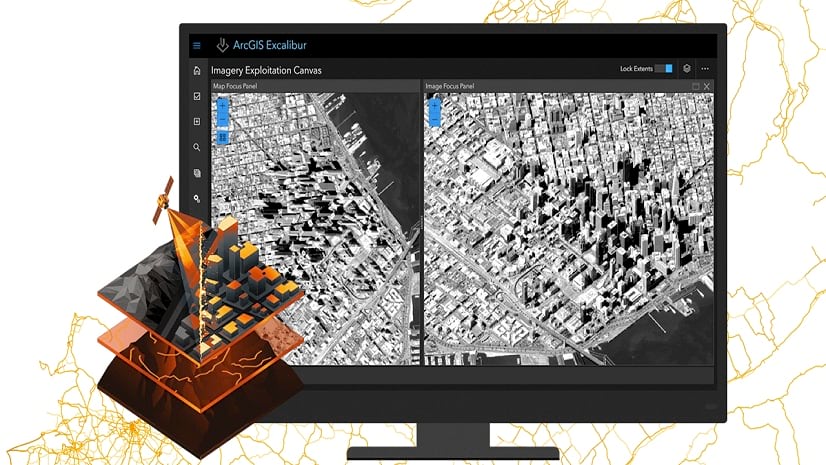
Image Discovery
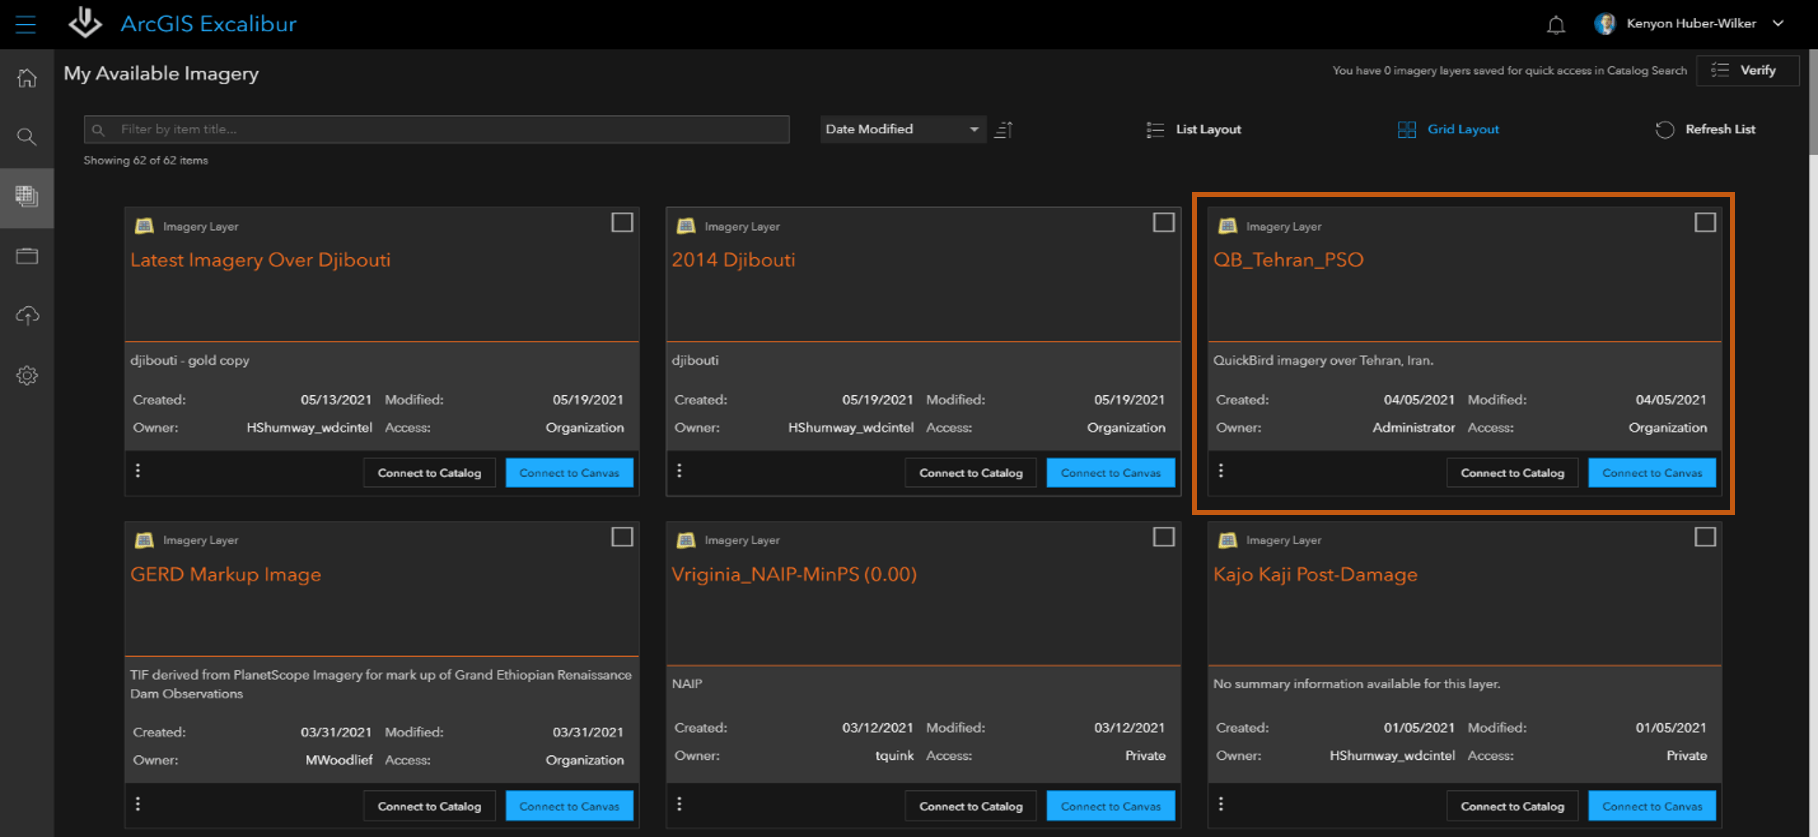
As an analyst, I know that I’m tasked with monitoring activity in and around specific targets in Tehran. Selecting My Available Imagery, I notice a service named “QB Tehran PSO”. Before using it to monitor activity, I’ll first “Connect to Catalog” to validate when the imagery was captured, what area it covers, and any additional sensor or imagery metadata needed to validate that it is the right service for my workflow.
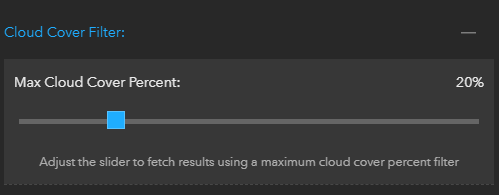
Since the imagery service has multiple collections with different footprints over this area of operations (AO), I want to find the collections with the least amount of cloud cover that intersect with the targets I’m interested in. To do that, I’ll use the Search Settings built into the Imagery Catalog Search, set my Area of Interest filter, and set my cloud cover filter to 20% before running my search.
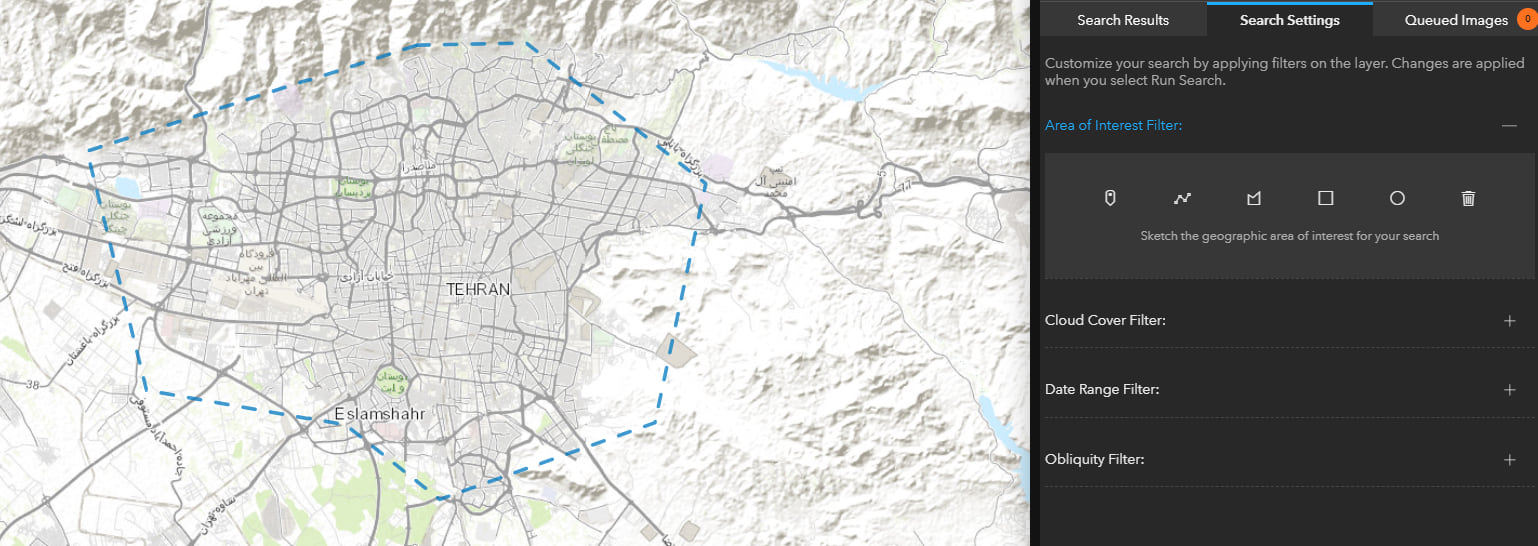
The search has returned four image footprints that I can view under my Search Results. I can preview the imagery and its associated metadata through the results pane.
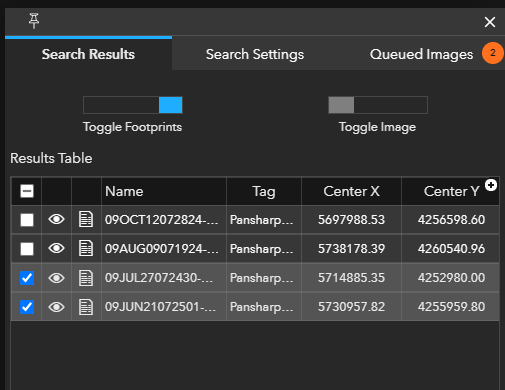
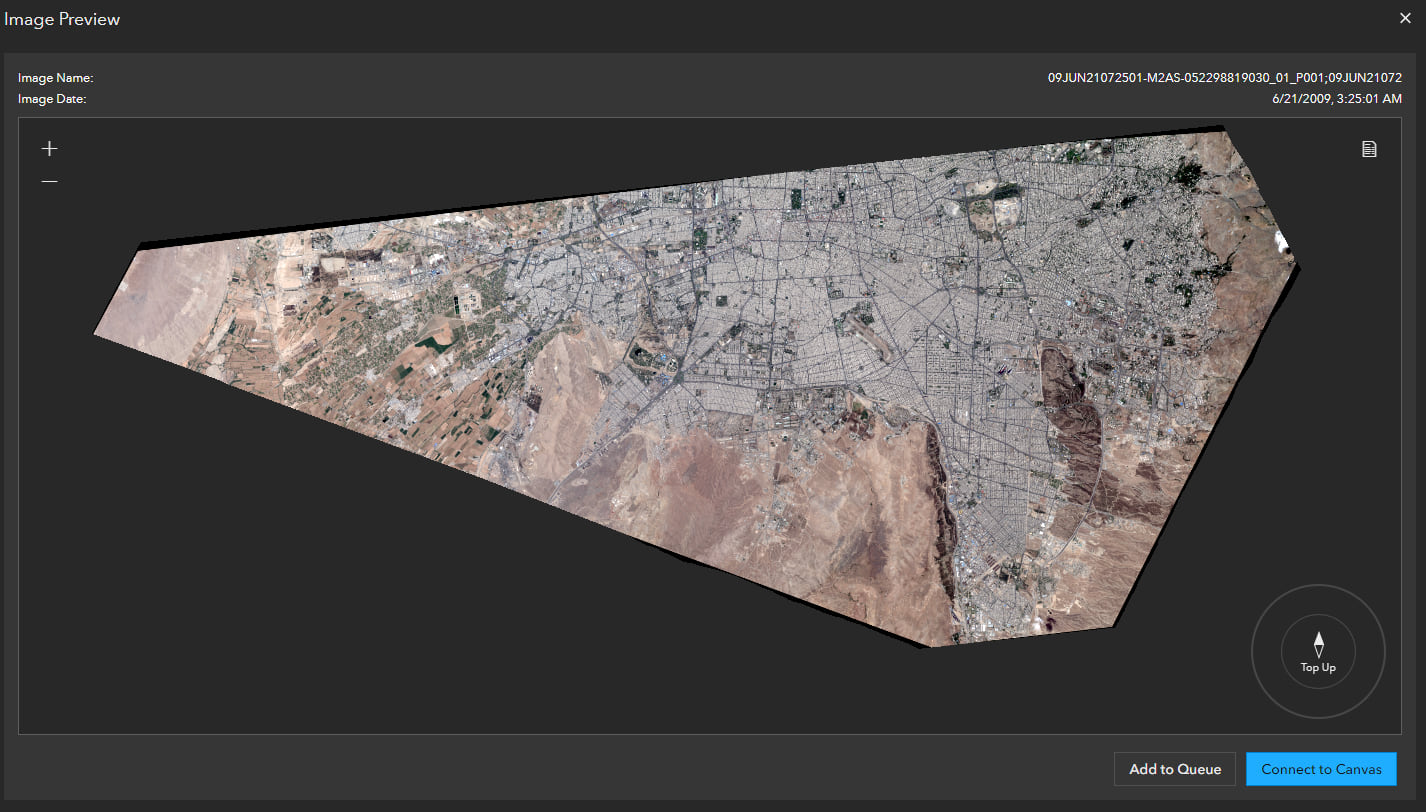
With two images added to my queue, I can choose to either connect straight to the canvas to begin performing ad-hoc exploitation, or if this is an area I want to create a common workflow around that I can collaborate on with colleagues, I can create a new project. In this case, we’ll continue down the ad-hoc path.
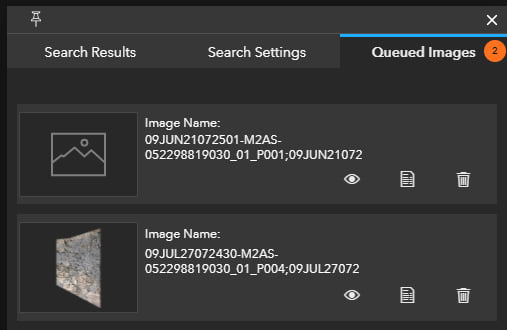
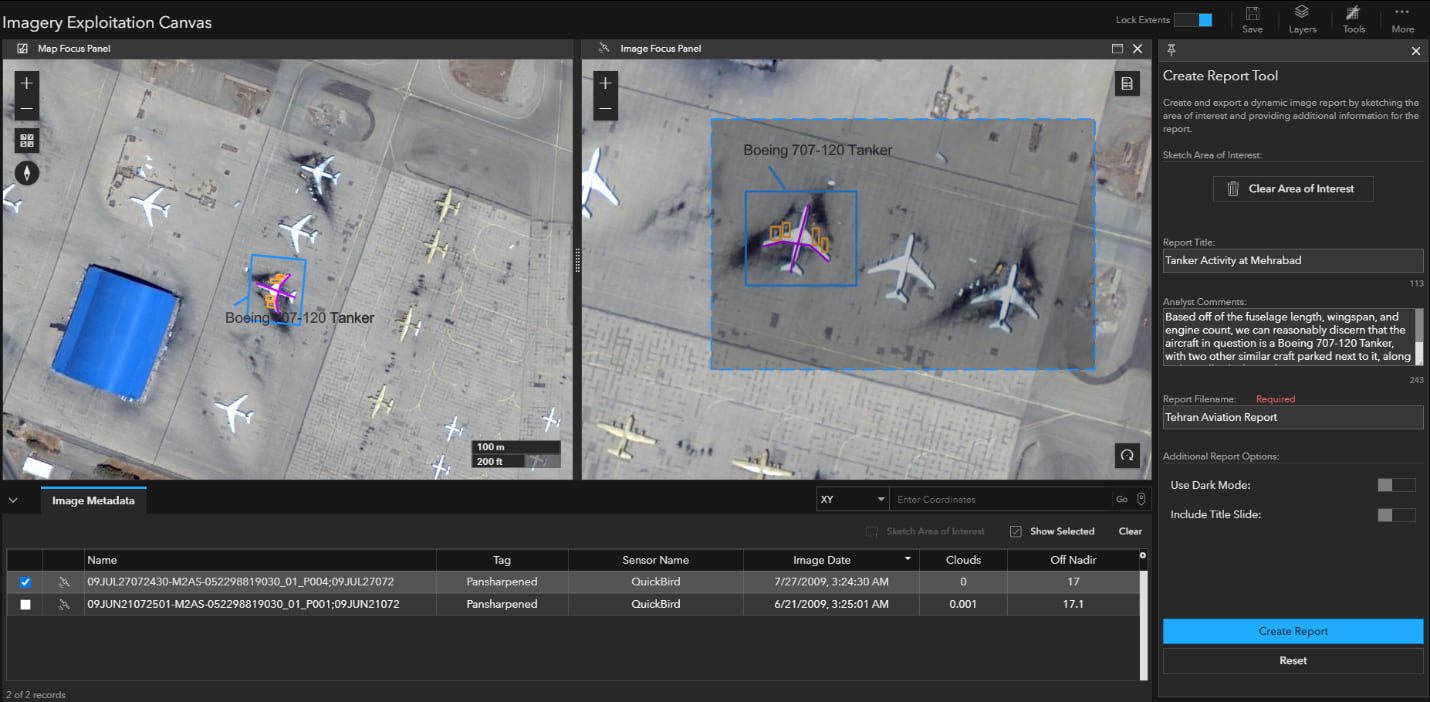
The two images encompass most of the Tehran metropolitan area, and today I’m going to focus on the air base located adjacent to Mehrabad International Airport.
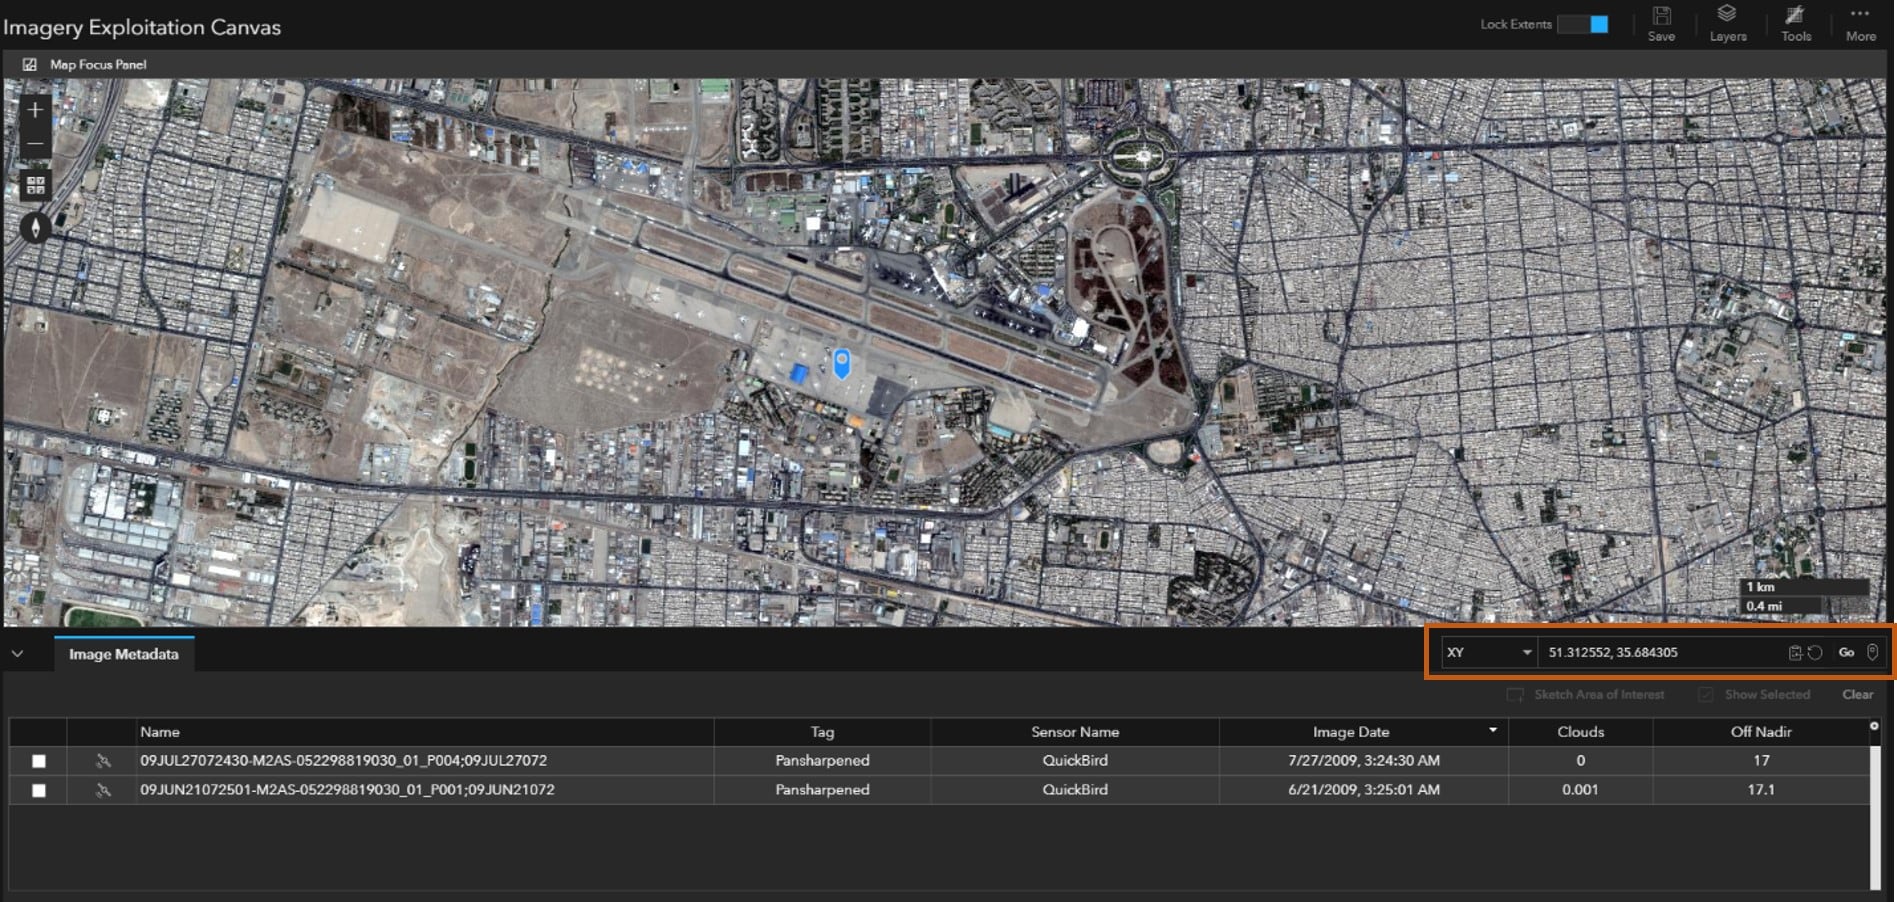
Knowing the airport’s coordinates, I can pull up the image metadata and paste them in to take me to the location on the map
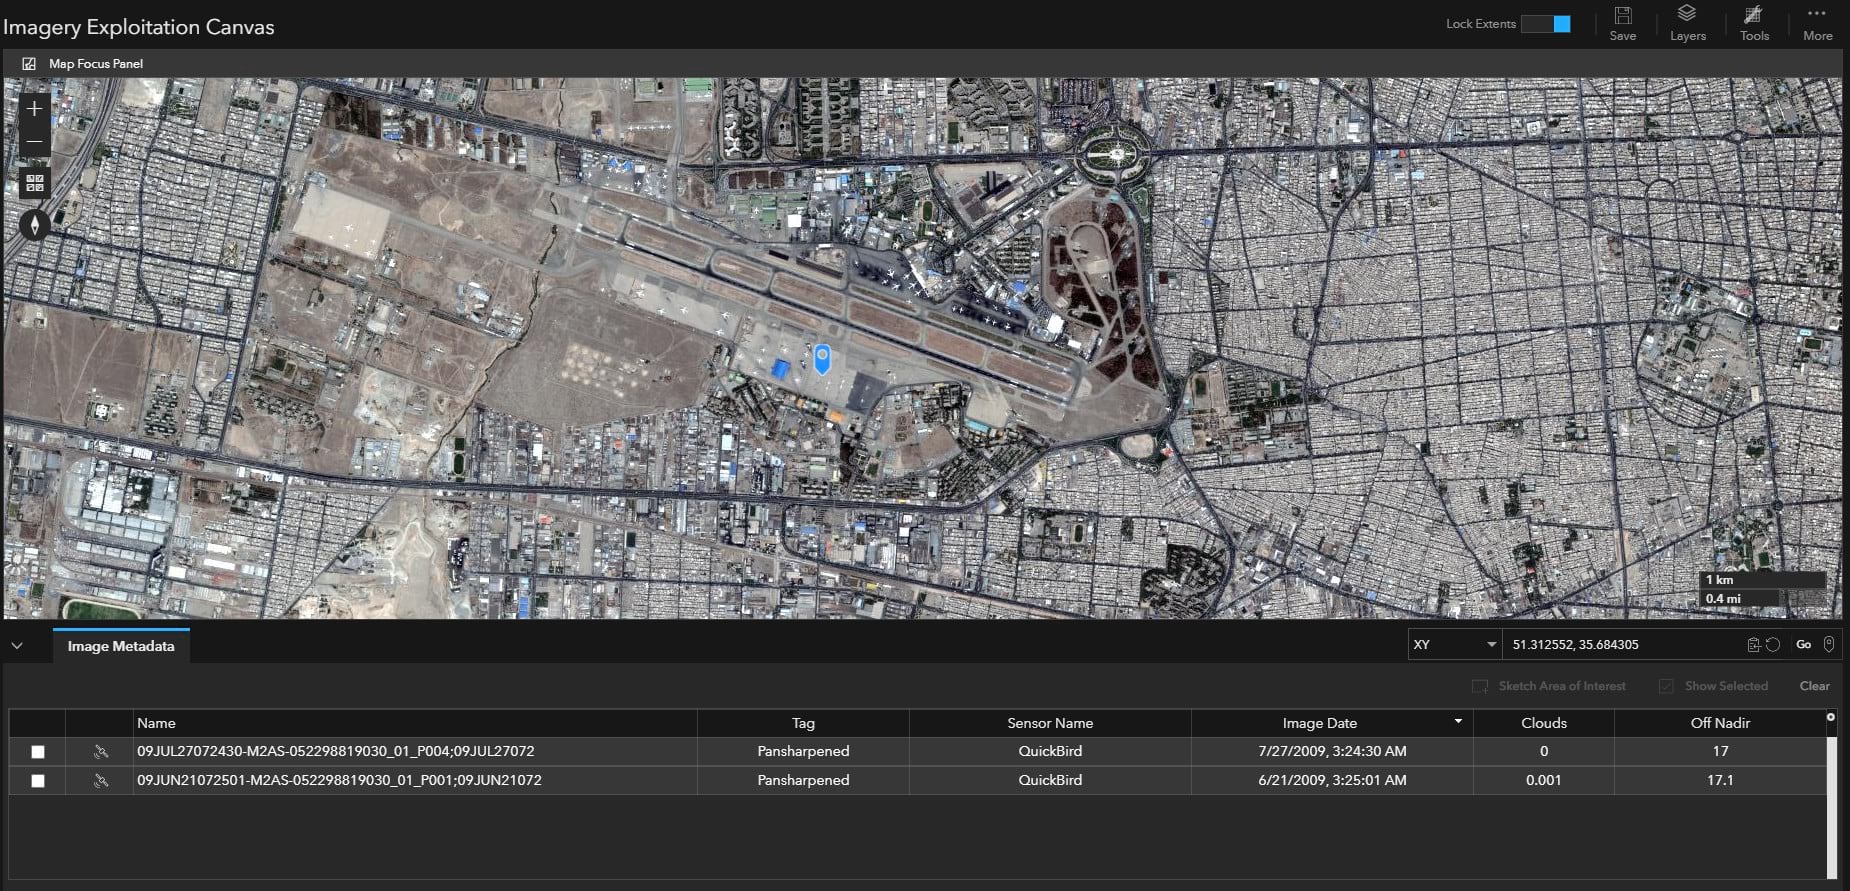
While cloud cover is low on these images, they are taken from a moderately oblique angle of 17%. I can use the Image Focus Panel to see the imagery from the same perspective that it was captured from the sensor.
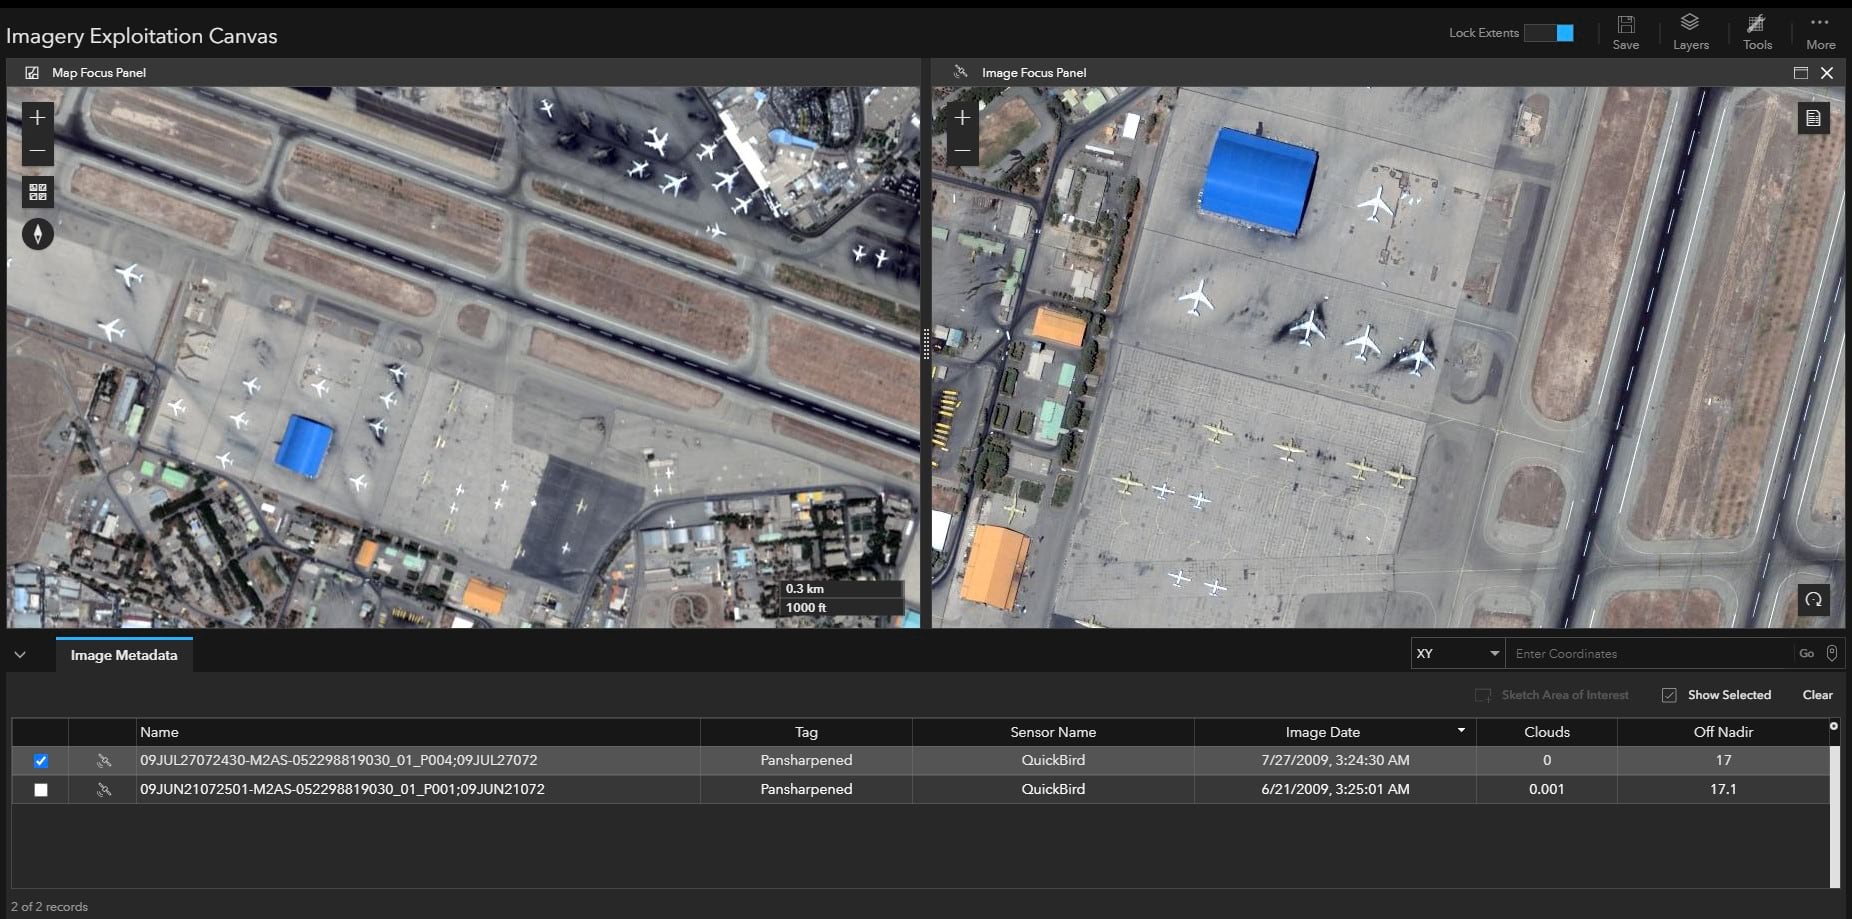
Image Exploitation
Zooming in on some of the craft at the air base, I can use my mensuration tools to capture two measurements, the length of the fuselage and wingspan, which are 145 feet and 130 feet respectively.
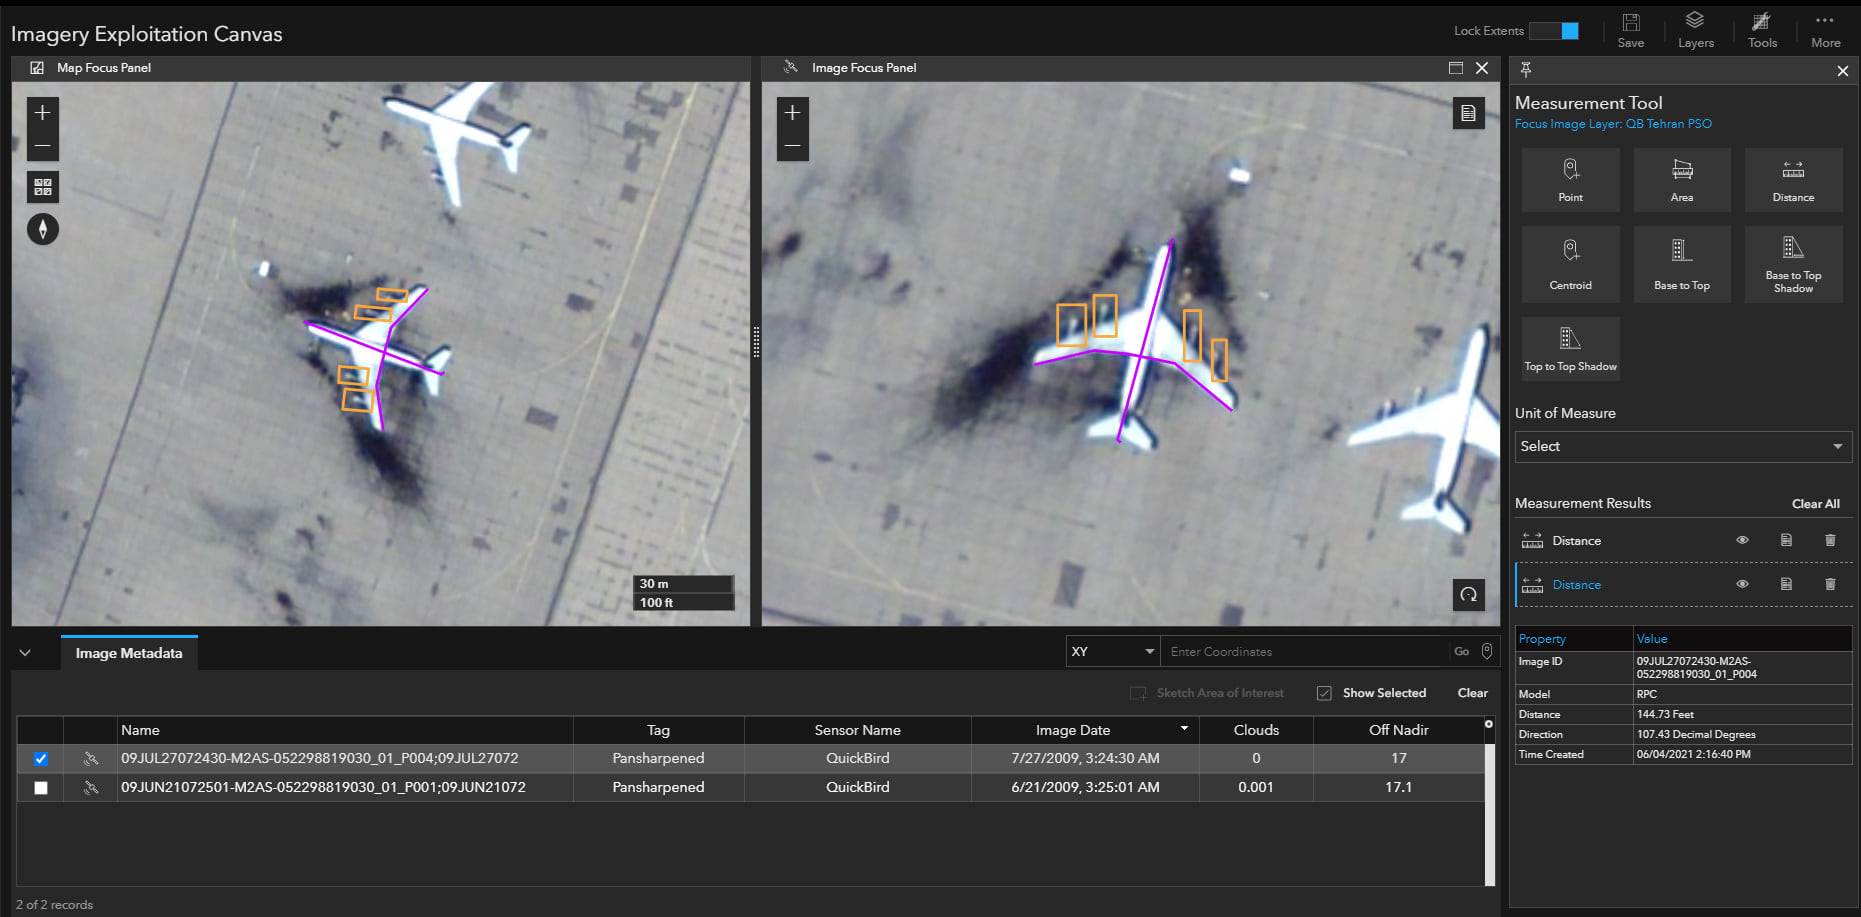
Next, I move to the markup tools to capture the number of engines attached to the plane, noting that there are four total, with two attached to each wing.
While multiple planes in the Iranian Airforce have four engines and are shaped like a tanker or cargo plane, only one is 145 feet in fuselage length with a 130-foot wingspan, the Boeing 707-120 air tanker.
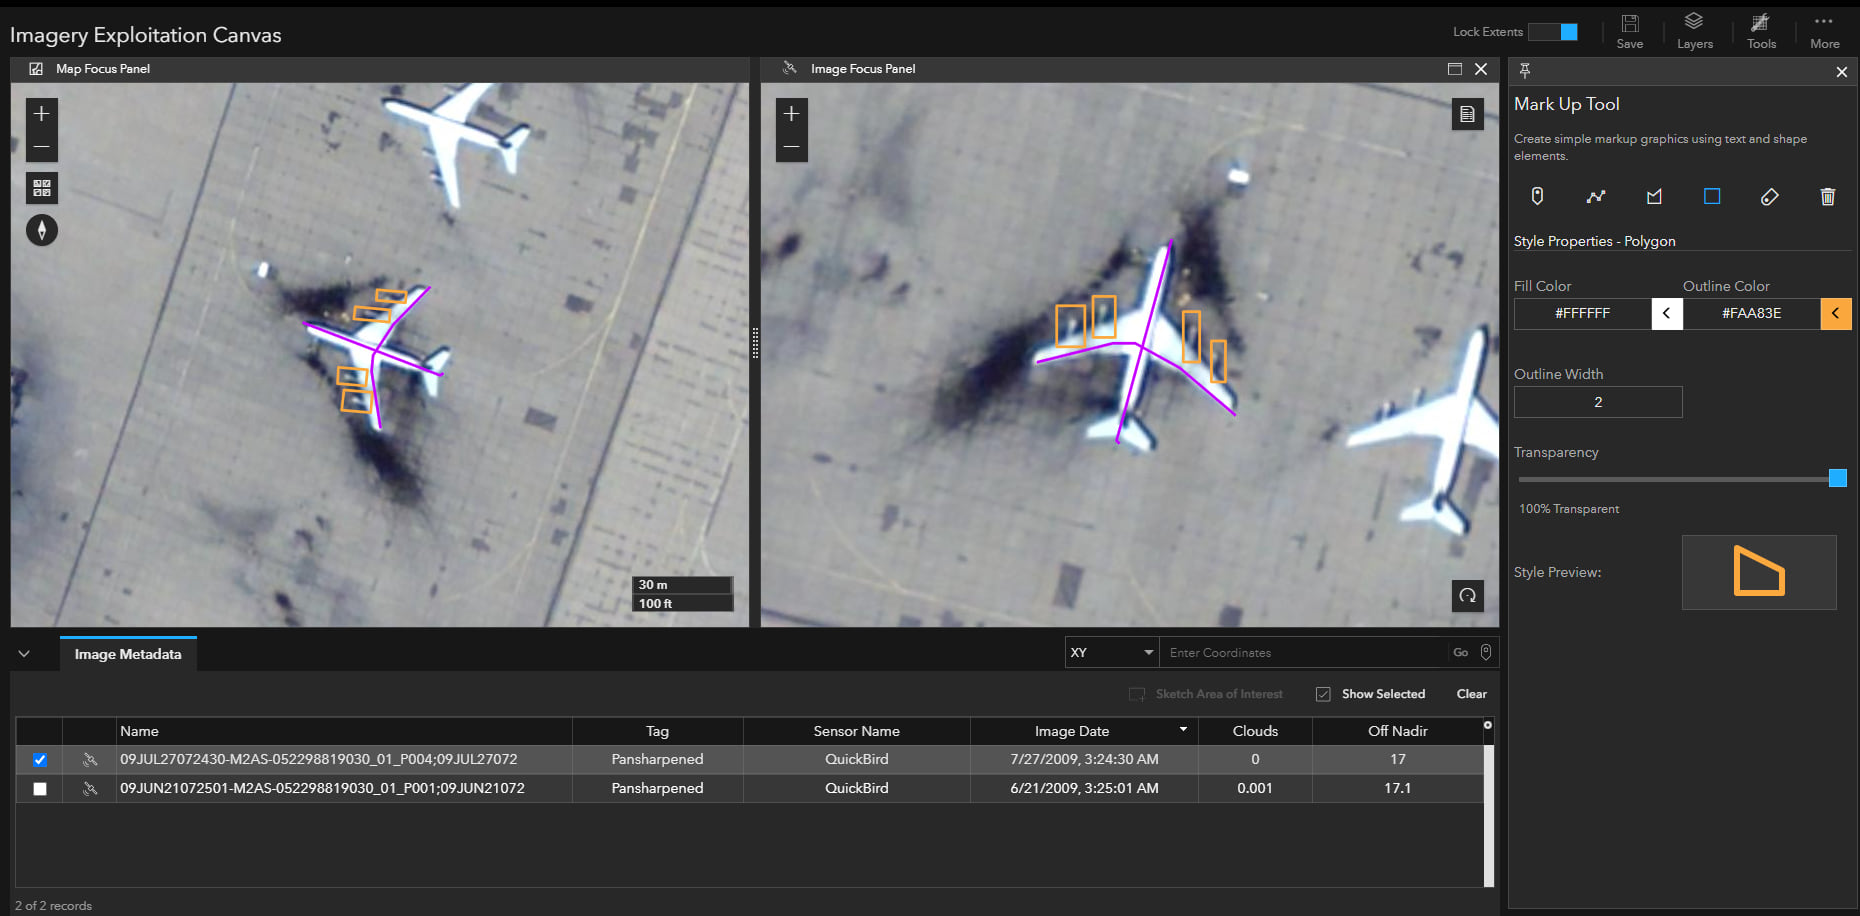
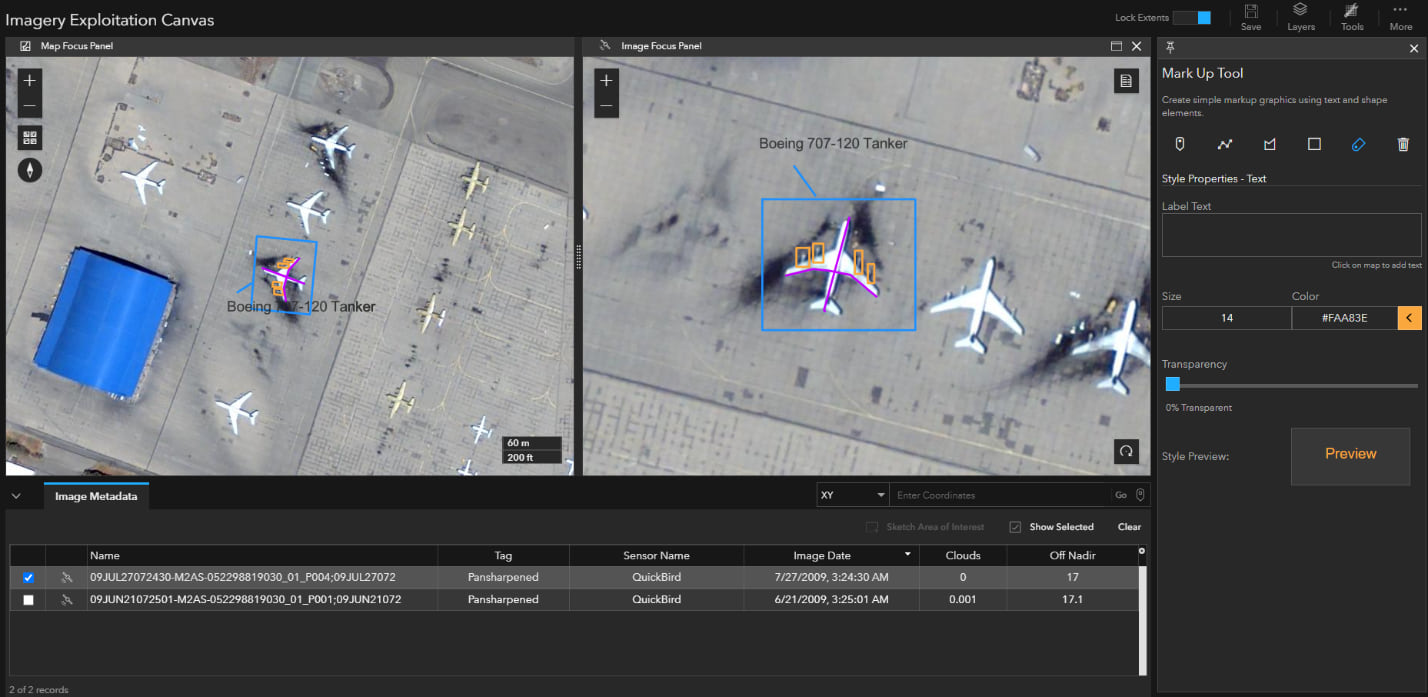
To denote this plane type, I’ll reopen the Markup tools and create a callout with text to capture the information for others.
Imagery Product Dissemination
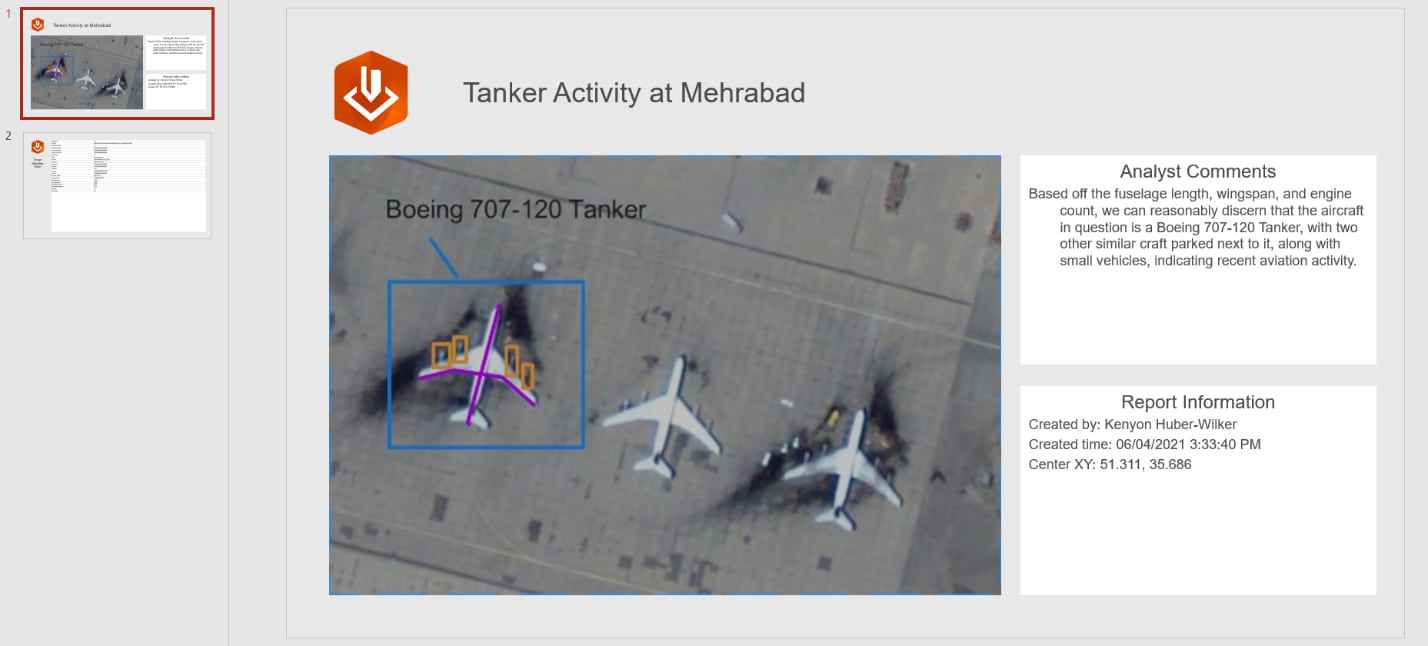
Finally, I’ll create a report that can be briefed to leadership, containing a title, remarks, and the markup that we just captured around the tanker.
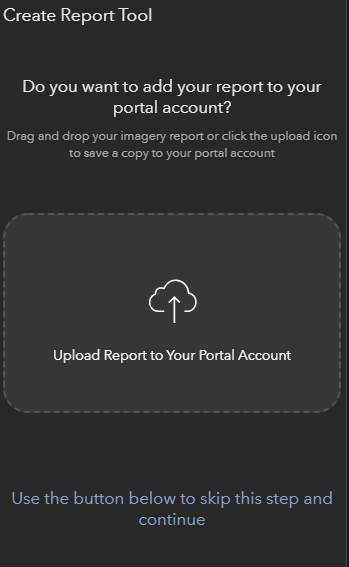
While the file will automatically save to my local drive, and I also have the option to upload it to my portal content to disseminate it to my colleagues.
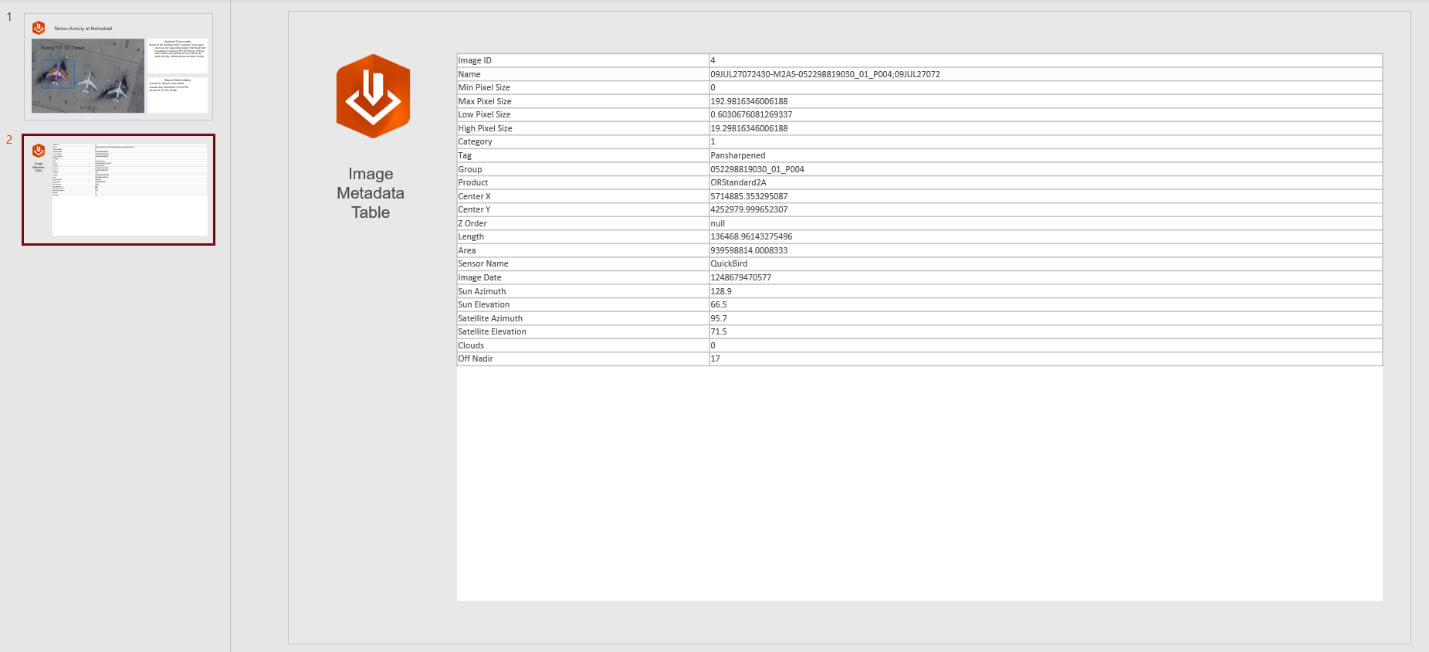
The report shows all the captured measurements, markup, and text in an easy to interpret PowerPoint and has an additional slide containing imagery metadata, should it need to be referenced when briefing the findings.
This is how you can use ArcGIS Excalibur to easily identify, characterize, and report on places of interest in your imagery services.
ArcGIS Excalibur will be featured in the 2021 Esri User Conference workshop: “Leveraging ArcGIS Across the Intelligence Cycle” on Wednesday July 14th from 7:30am to 8:30am Pacific Time, followed by a live Q&A. More details about the workshop can be found here.

Article Discussion: