Processing templates are a powerful tool for expanding the capabilities of image services. By chaining together a series of raster functions, they provide users with the capability to do on-the-fly analysis, such as converting units, finding anomalies, and calculating slope, without changing the original data or creating derivative products. Processing templates can be as simple as a classified renderer, used for complex tasks like band arithmetic, and can even incorporate custom Python code.
ArcGIS for Server 10.4 further extends them by allowing web services to specify more than one processing template in a query. This means that instead of asking for the elevation of a pixel, or the slope of a pixel, or the aspect of a pixel, one query can get all three values.In ArcGIS Online, you can configure your web map’s pop-up windows to take advantage of this new capability. If you want to report the value of a pixel based on the same processing template that is being used for visualization, it is represented by the variable {raster.ServicePixelValue}. If you want to report that value of that pixel using any of the image service’s other processing templates, use the format {raster.ServicePixelValue.ProcesingTemplate}.
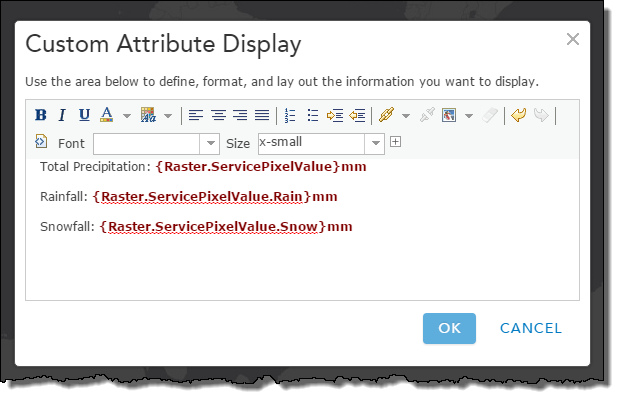
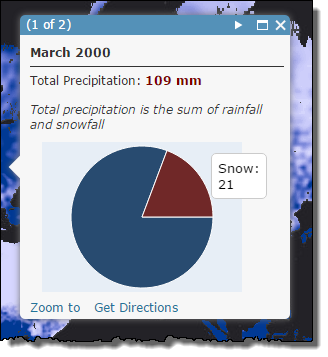
A good example of this functionality in action can be seen in the GLDAS maps, which are built from multidimensional data and use processing templates to filter between the different variables. For example, the Monthly Precipitation map is drawn using a processing template that sums rainfall and snowfall together to show total precipitation. When a user clicks on the map, the pop-up window uses two different processing templates to create a pie graph showing how much of that total fell as rain and snow.
For imagery, this means your map can be in true color while the pop-up reports NDVI or a moisture index. For elevation, you can apply the hillshade processing template while configuring a pop-up that reports the raw elevation, aspect, and slope. When working with scientific data, this means that renderers can be used to convert your data to RGB, and the un-rendered pixel values are still accessible.
Remember: processing templates have to be configured on the image service before you publish it, so determine what information you want the web map’s pop-ups to convey, then work backwards to determine what processing templates you need to include. As powerful as they are, processing templates are often under-utilized, so get creative. Think about creating media like graphs and charts where appropriate, include images, and vary font colors. Exciting pop-up design can help illuminate the hidden meaning in your data, and bring your maps alive.

Article Discussion: