Link analysis can be used to help understand relationships within your data. When visualized as a link chart or link map, connections can be analyzed and quantified to reveal underlying patterns. We’ve implemented several new enhancements in our latest release that expand the ways to analyze and work with your link analysis cards.
Link weights
Entities are the nodes within the network, they can represent people, places, or things. Links, or edges, are the connections between these nodes in the graph network. Links between entities can represent relationships such as movement, transactions, or other forms of connections within your dataset.
When displaying these links in link charts and link maps you can choose to style these connections with the Edge weight parameter. This value will scale the width of the link to indicate either the frequency of connections between nodes or a numeric value relevant to your analysis. For instance, you might style links to visualize:
- the frequency of interactions between individuals in a social network
- the monetary value transferred between financial accounts
- or the lines of dialog spoken by characters in episodes of my entirely fictional sci-fi television series Rocket McDangerface.
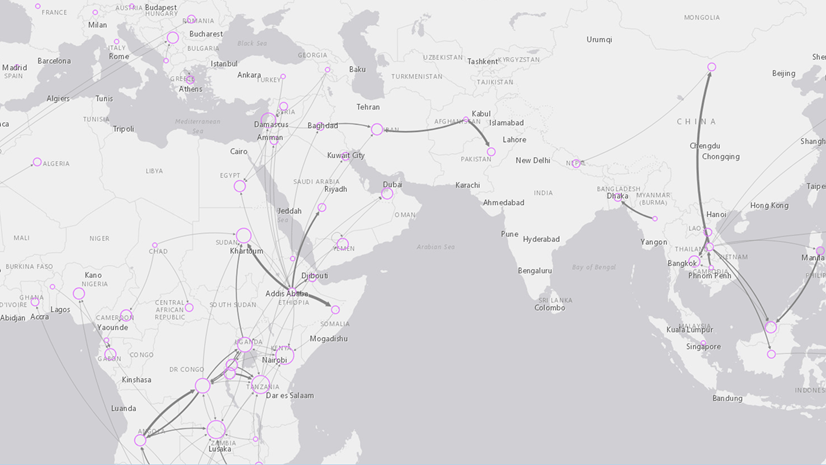
Links in space
Exploring my entertaining sci-fi television example, I’ve created a link chart to show each of the characters and the episodes in which they appear. I’ll use closeness centrality to explore the network of characters and episodes and our link chart will visualize this centrality by scaling the character nodes.
In this dataset, a character is recorded in a single row if they appear in an episode. Therefore, in our network all the connections have the same appearance. The number of these simple edges radiating out from each character illustrate their prevalence over the series. However, if we were to encode the dialog attribute in our link chart, we could visually approximate the importance of characters within each episode.

Configuring link chart/maps with additional visual channels can provide cues as to the nature of the interactions or relationships between nodes within your dataset. However, in the sequence above you’ll notice that apply our dialog weight only styled the lines. The character nodes retain their calculated size. How great would it be if we could incorporate the dialog measure into calculating the importance of each character?
Weighted centrality
This brings us to our first enhancement. We’ve implemented weighted versions of our centrality algorithms, the same frequency or numeric measures used to style your links can now be used as a variable in calculating centrality. This weighting of centrality translates to nodes being calculated as more important within the network when their connections to other nodes occur more frequently or have a greater weight than others. If we apply this to our character analysis, we can calculate an analytical measure of their importance and visualize their weighted centrality.
Centrality in space
Using our previous link charts, we have a link chart showing the characters and the episodes where they appeared. I’ve also scaled the connection width using the lines of dialog each character spoke in the episode.
For context, I’ve imagined that Rocket McDangerface and Stella Stardust are our heroes and Hugo Von Meteor is the dastardly villain. Right away, you’ll notice that these characters appear as prominent nodes in the network. Since these characters are featured in many episodes alongside many other characters, their degree centrality is calculated to be higher than others (other centrality measure can be used to emphasize different types of influence). However, the simple metric of their presence in an episode also calculates Astra Galactic as having significant importance despite them being a tertiary character in the structure of the show.

To calculate a more relevant measure, we could apply the dialog lines as a weight to our centrality calculation. This method will augment the centrality of each character based on how many lines of dialog they were assigned per episode.

Using the dialog weighted degree centrality scales the characters in a way that better visualizes the nuances of their importance in the show and the influence they had within each episode. Rocket, Stella, and Hugo become much more visually prominent compared to other characters. Additionally, the Astra Galactic character assumes a more background importance as a supporting character. Unfortunately, this also means that the trusty sidekick and my personal favorite character, Cadet Spiff, also inherits a much lower importance in the cast of characters.
Viewing centrality calculations
Using these new calculations, we can visualize the weighted centrality and examine how the centrality of nodes has changed by applying our edge weight. Visually examining the network and comparing the nodes or inspecting pop-ups is always an option, but not very convenient if you’re reviewing many nodes in a complex network.
Enter our second enhancement related to link analysis! Maybe you’ll have noticed the new View centralities option within the Graph options group? Clicking this option will add a new reference table card to your workbook containing the results of the calculations. This table is organized with the following columns:
- Entity: indicates the entity group to which the node belongs. In a movie production network, the entity might denote whether a node is a movie, cast member, director, or writer.
- Node: this column provides the identifier specific to each node. In our movie production example, this might contain the title of the movie or the name of the cast/production member depending on the entity of the node (link maps derive this column from the Display field configured on the Location field).
- Centrality: this column contains the calculated centrality value for the node based on the current algorithm parameters and graph configuration. This table is tied to the link map or link chart and will update accordingly as graph configuration occurs.
As an example, let’s return to our character link chart. Viewing the centrality calculations in the table makes It super convenient to sort, review, and select entities from the link cards and have them displayed in the table for comparison.

That covers our enhancements to link analysis for this release. Using the weighted centrality algorithms and viewing calculation results in a table, should make performing link analysis and uncovering patterns in your data that much easier!
If you’d like to dive deeper, check out this workbook that showcases these new features.


Article Discussion: