Legends help your audience recognize and understand data that is displayed on a map. Interactive Legend is a map-based Instant App that allows you to explore feature layers in the map by interacting with the legend.
This article will illustrate how to choose the best configuration options to craft an engaging experience for your audience and introduces some helpful tools like the ability to take screenshots.
To use this app, you will need a web map with a feature layer using one of the supported drawing styles, see Supported Drawing Styles below for the details.
You can use the interactive legend to emphasize a specific category or set of categories to gain a deeper understanding of the data and how its distributed over space through a simple user interface.
For example, the Global Power Generation referenced below shows the distribution of different types of power generation used around the world. The Interactive Legend app allows you to explore this data to ask and answer questions in an interactive way. Using the legend, you can click on the Hydro primary fuel category. This allows you to understand the distribution of Hydro power generation and click on individual map features to find out more about a specific plant.

Visualization Modes
When configuring the app, you can enable layer effects. Use layer effects to differentiate between features included and excluded in the legend selections. You can choose how features are emphasized and de-emphasized when a filter is applied from a list of paired layer effects. These effects include options like drop shadow, blur, and bloom. These effects are grouped based on your basemap map color. If using a light basemaps, effects that are best seen on light backgrounds are selected and the same with dark basemaps. These effects all use the client-side filtering capabilities. Handling this filtering on the client, produces a much smoother interactive experience than making the requests to the server.
In the example below, the app displays where spacecrafts have landed when they return to earth. The landing sites are categorized by project. When Apollo is selected in the interactive legend, a bloom effect to those features and all other landing sites are grayed out, moving the visual focus to the Apollo landing sites.

Layout Options
Recently Interactive Legend added a new layout option and a new refreshed look. In addition to the default, floating legend, a second layout option has been added to the app. The side panel layout option docks the legend on either side of the map. This helps provide more room when a legend contains a large amount of content. One big advantage of this layout is it does not overlap with the map and provides a larger area to view and interact with the legend.

To update your Interactive Legend app, navigate to the Interactive Legend section and select Side panel. Directly below the Side panel selection is the location to choose the side of the app it will appear on.

Interactive Legend has a new look with some new functionality as well. The button style and the ability to collapse individual sections of the legend have been updated to make it easier to interact with the app. There are no settings required to be enabled to use this functionality.

Time Filters
In addition to filtering features by the legend you can also use a time slider to filter features on the map. The time slider option is available when the map contains a time-enabled layers. Located in the Interactive > Modify section of the configuration panel, the time filter setting enables the time slider with settings to set start and end date, with increments.
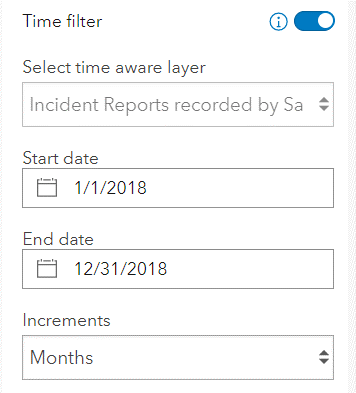
Using the legend and time filter, map features be explored in a more granular and focused way, providing deeper insights into the patterns and trends present. In this example of crime data in San Francisco, the map is filtered to show two types of crimes over a 3-month period.

Additional Options
The primary purpose of the Interactive Legend app is to enable your audience to explore the map by emphasizing different classifications data. But you might want to include other things to support the message of your map. For example, enable an introduction panel to help introduce the topic of the map. Interactive Legend includes these additional options:
- Introduction panel
- Layer List
- Search – feature search will honor what is currently filtered by the legend.
- Basemap Toggle
- Screenshot tool
- Social sharing
- Navigation Boundary
- Custom theme and logo options
- Help panel
- Feature Count
- Zoom to button
The Screenshot tool will let you capture an image of the map, with the option to include a legend or the pop-up for a feature. This allows you to create a static version of the map for further sharing or inclusion in a report. The Help panel provides in-app documentation to support the use of the Interactive Legend and Screenshot tools.
The last two allow you to show the total number of features in the map and the count for each legend element(s), and the ability to zoom to the active features in the legend.
For a full list of app capabilities, visit the documentation on Interactive Legend.
Supported Drawing Styles
The drawing styles currently supported by the interactive legend app include:
- Types (Unique symbols)
- Predominant Category
- Counts and Amounts (Size) – Classify Data Checked
- Counts and Amounts (Color) – Classify Data Checked
- Predominant Category and Size (Partially interactive)
- Types and Size (Partially interactive)
- Relationship
- Relationship and Size (Partially interactive)
- Location (Single symbol)
When working with the two Counts and Amounts drawing styles, you will need to ensure that the data has been classified in order for it to be supported by the Interactive Legend.
When working with the three partially interactive drawing styles, keep in mind that the size portion of the legend will not be interactive, but you will be able to filter the data based on the category or type elements of the legend.
If an unsupported drawing style is used in the app, a message will be reported in the configuration panel noting that the map contains a drawing style that is not supported for interactivity.
Other Examples
Explore additional examples of the Interactive Legend in the product gallery. We look forward to seeing what you create!


Commenting is not enabled for this article.