Version 5.2 is the final release to include widgets and the deprecated view UI and popup in MapView, SceneView, and LinkChartView. See below for details.
ArcGIS Maps SDK for JavaScript 5.2 gives you new ways to build accessible, interactive mapping experiences, work with existing geospatial content, and create more capable 2D and 3D applications. This release adds dynamic editing inputs, built-in keyboard map interaction, new selection workflows, Geospatial PDF layer (beta), formatted and callout labels, analysis with Gaussian splat layers, updates for agentic applications, and much more.
Version 5.2 is a minor release under the SDK’s semantic versioning model, so you can adopt these new capabilities without the application changes associated with a major release.
AI Assisted Development
New guides: A new AI-assisted development guide covers how to give coding assistants relevant SDK context, use documentation and examples to guide code generation, and review generated code for accuracy.
Optimized content for agents: Reference, guide, tutorial, release note, and sample pages are also available as Markdown. The structured Markdown versions reduce unnecessary page content and token usage when people or agents process the documentation.
Build agentic applications with more accurate and interoperable agents (beta)
AI components include updates that significantly increased the accuracy and reliability of data exploration and agent responses, improved interoperability between custom agents and agents provided by the SDK, and a new approach for creating custom agents with reusable skills.
Improved accuracy: The underlying large language models used by AI components are more capable, accurate, and reliable due to an upgrade to the GPT-6 family of models.
Component improvements. We made several UX and developer experience enhancements to the component, including making it easier to progressively display components as part of agent responses.
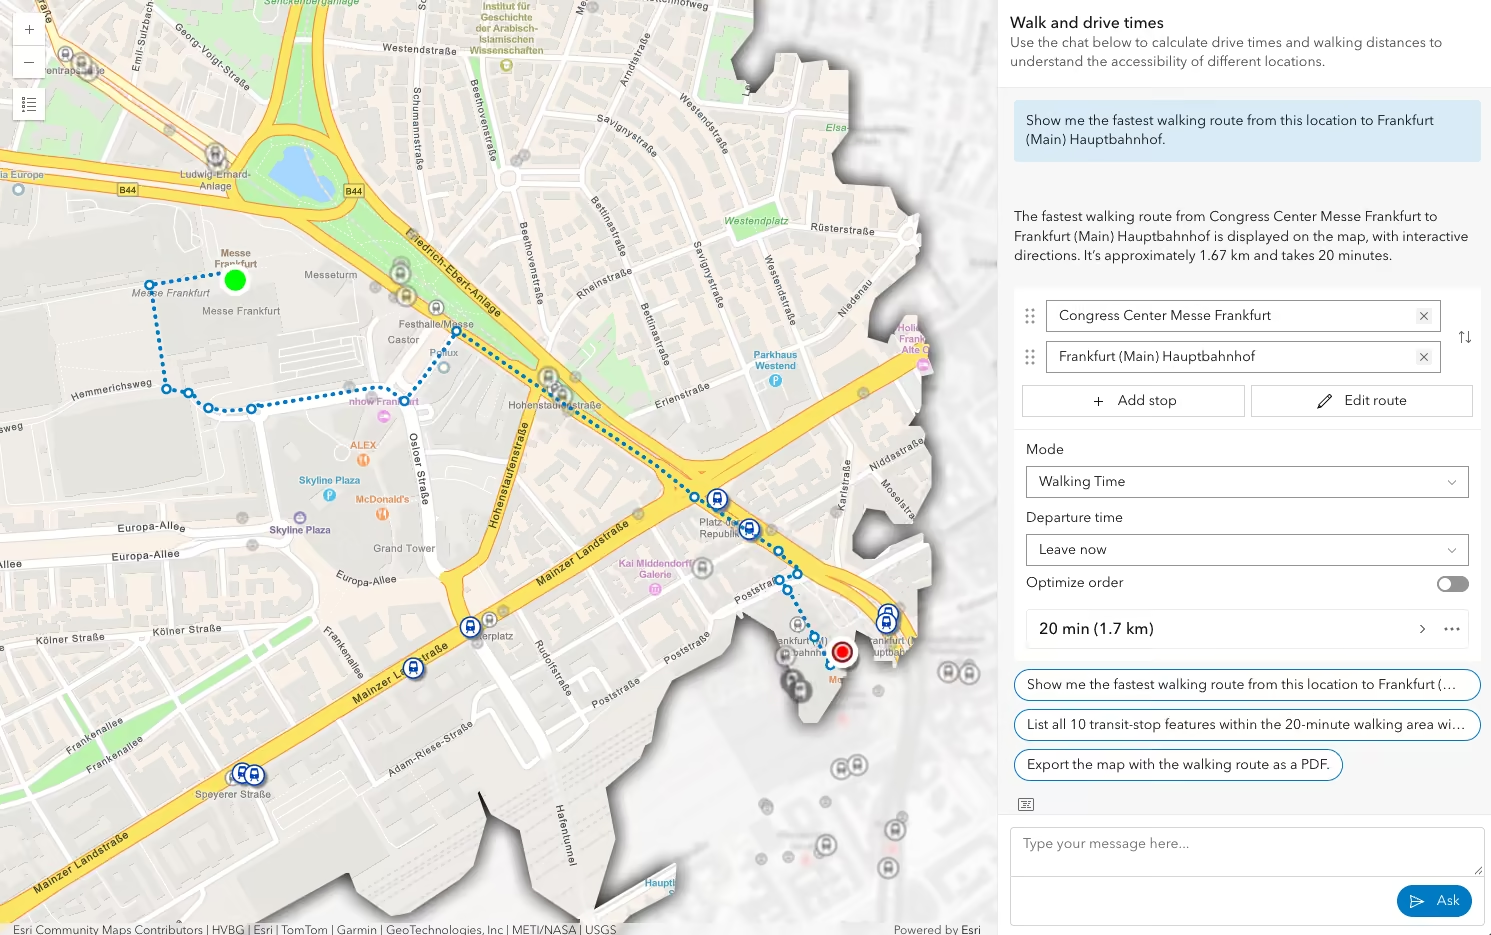
Shared resources: Agents and their tools can add resources to a common workspace where other agents can use them as input. For example, a custom agent can generate a polygon as a shared resource that the Data Exploration agent later uses for a spatial query or filter.
Skill agents: Skill agents let you create custom agents from reusable skills and tools that load on demand. Agent logic can be defined using natural language in Markdown files instead of maintaining complex graph code.
The Navigation, Data Exploration, and Help agents were refactored to skill agents. Combined with the GPT-6 family of models, these changes result in more accurate, better-qualified, reliable, and transparent answers.
Enterprise support: ArcGIS Enterprise 12.2 supports agentic web applications that explore web map data from an Enterprise portal. The organization must enable AI agents and provide credentials for an ArcGIS Online organization that supplies the AI models.
There are many more improvements to AI components; see the release notes for more details.
Add dynamic choices to editing forms
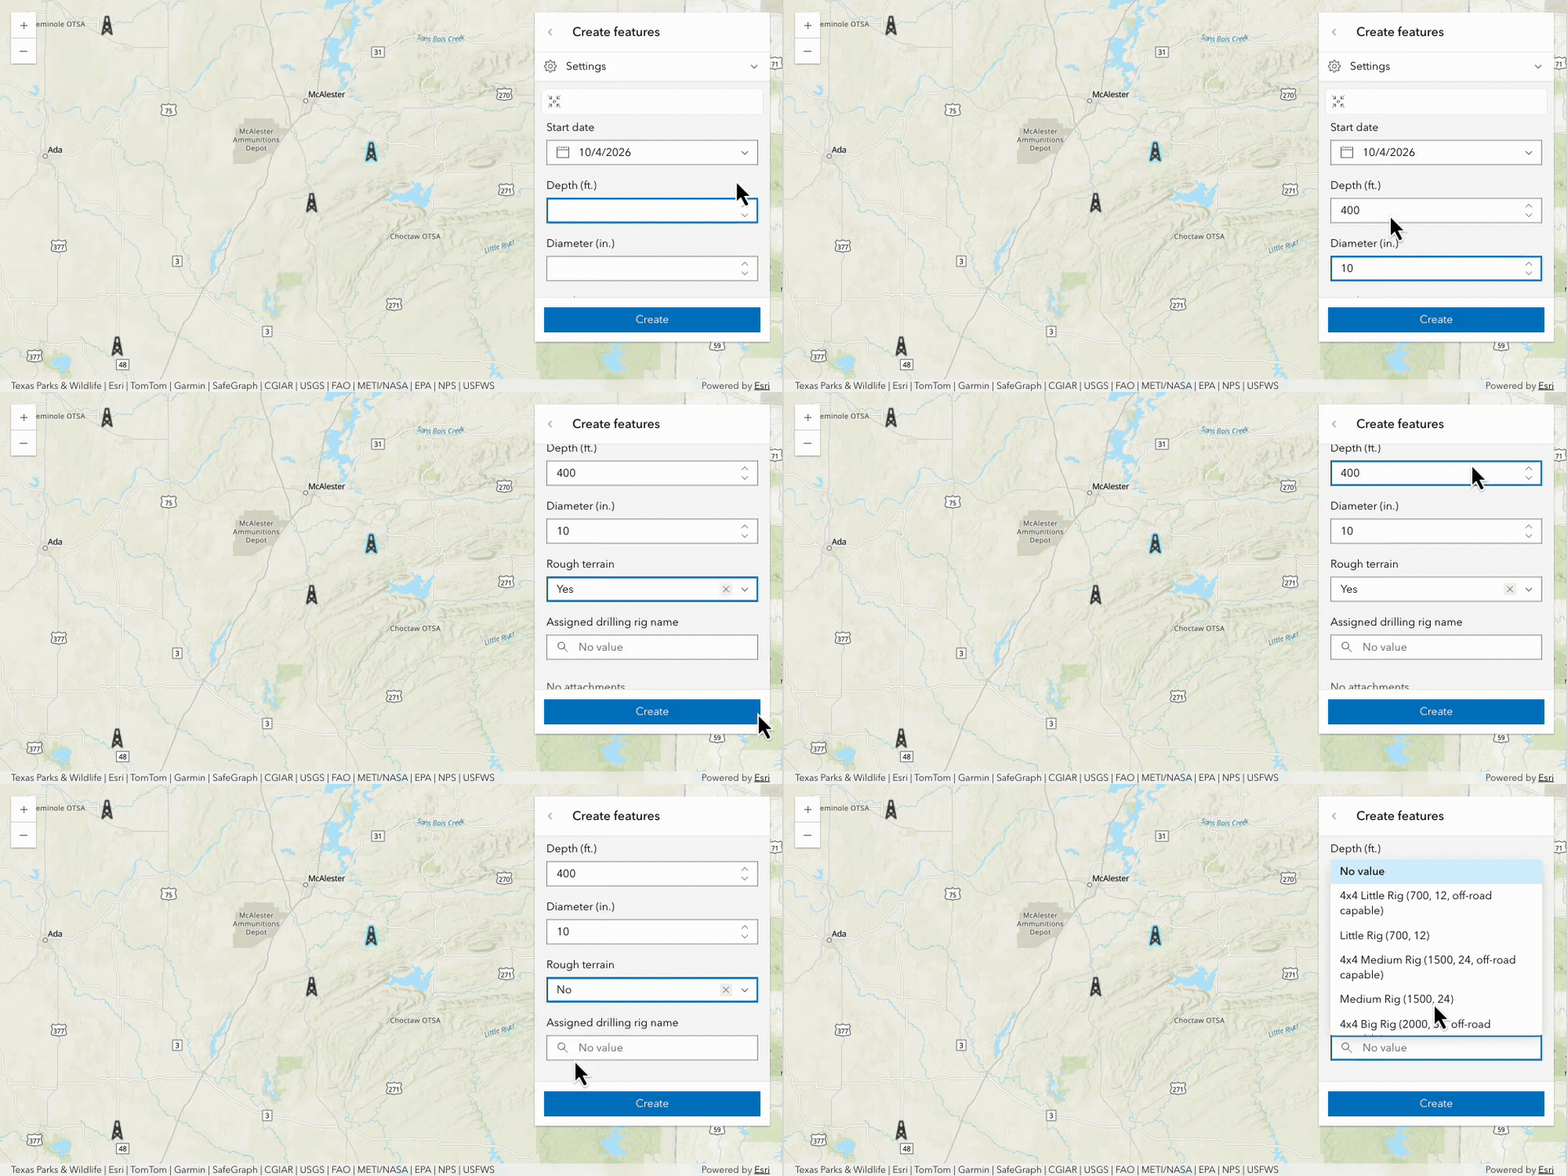
Form-based editing now supports dynamic choices driven by Arcade expressions. Available choices can respond to the feature being edited, values entered in other fields, or data from another layer or table. Dynamic choices work with both single- and batch-editing workflows.
Add selection workflows to your apps
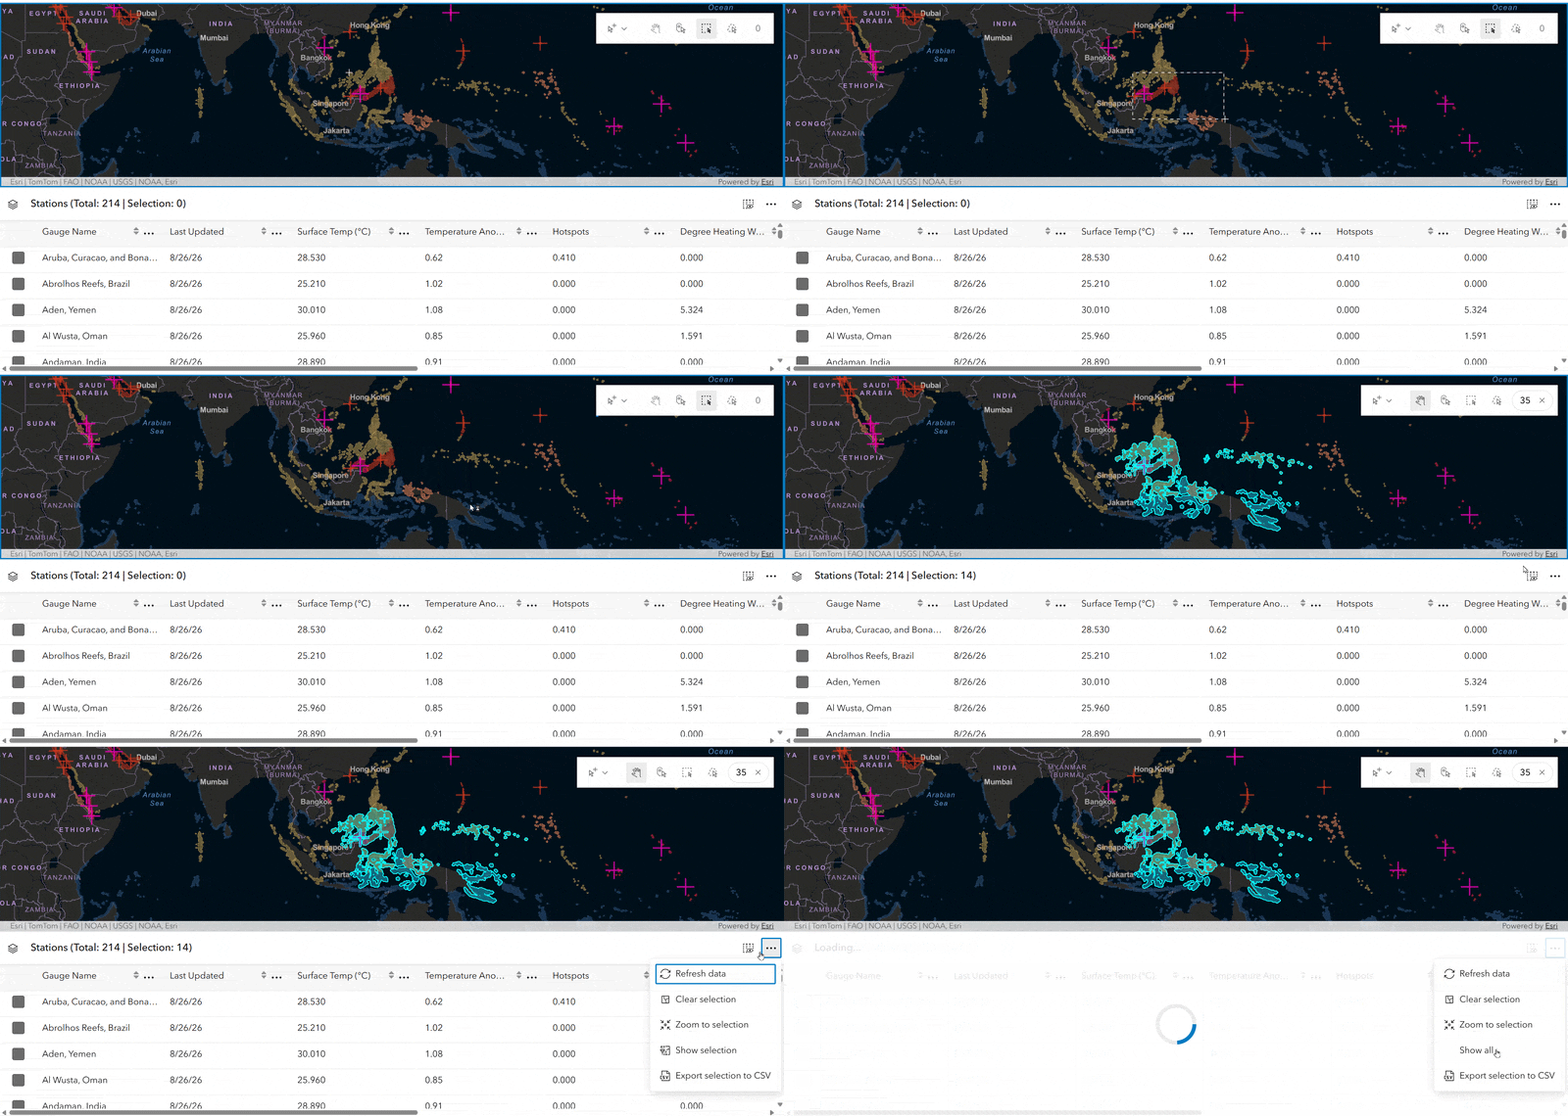
The new SelectionToolbar and SelectionList components provide a simple way for you to integrate selection workflows into your app. Users can add to, replace, remove from, or clear a selection in a map or scene. SelectionList organizes selected items with controls for browsing, filtering, expanding, collapsing, zooming to, and removing selected items.
The components share a view’s selection state by default and also support custom selection managers. The same selection can update a map, feature table, chart, and selection list.
Create callouts to labels
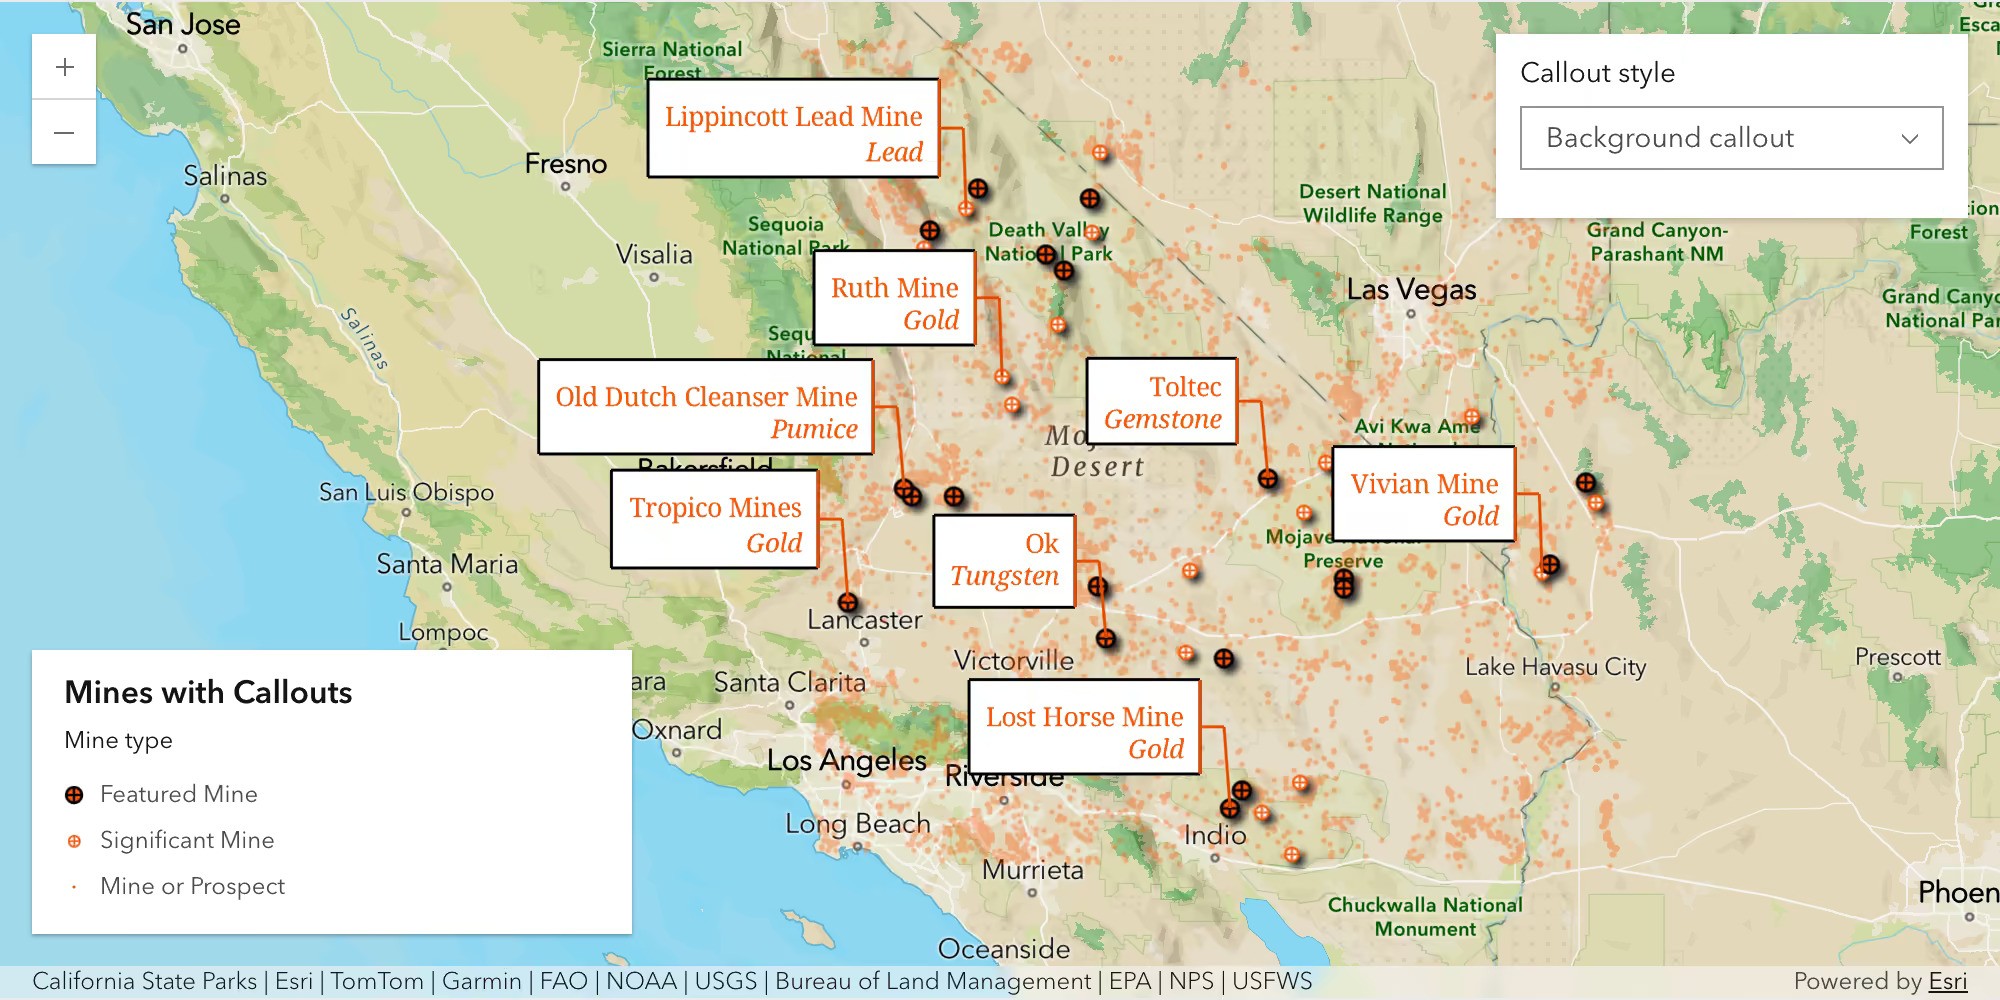
Callouts can now be added to 2D labels, visually connecting each label to its feature without covering the mapped feature. Callouts include a leader line and the label that can be styled in a variety of ways; for example with a rectangular bubble behind the label.
Apply formatting to labels
Text formatting tags let you apply different formatting to individual parts of a label. A single label can combine different colors, fonts, sizes, bold, italics, underline, character spacing, and multiple lines. Mixed formatting is currently limited to 2D and is supported in FeatureLayer and MapImageLayer labels that use Arcade.
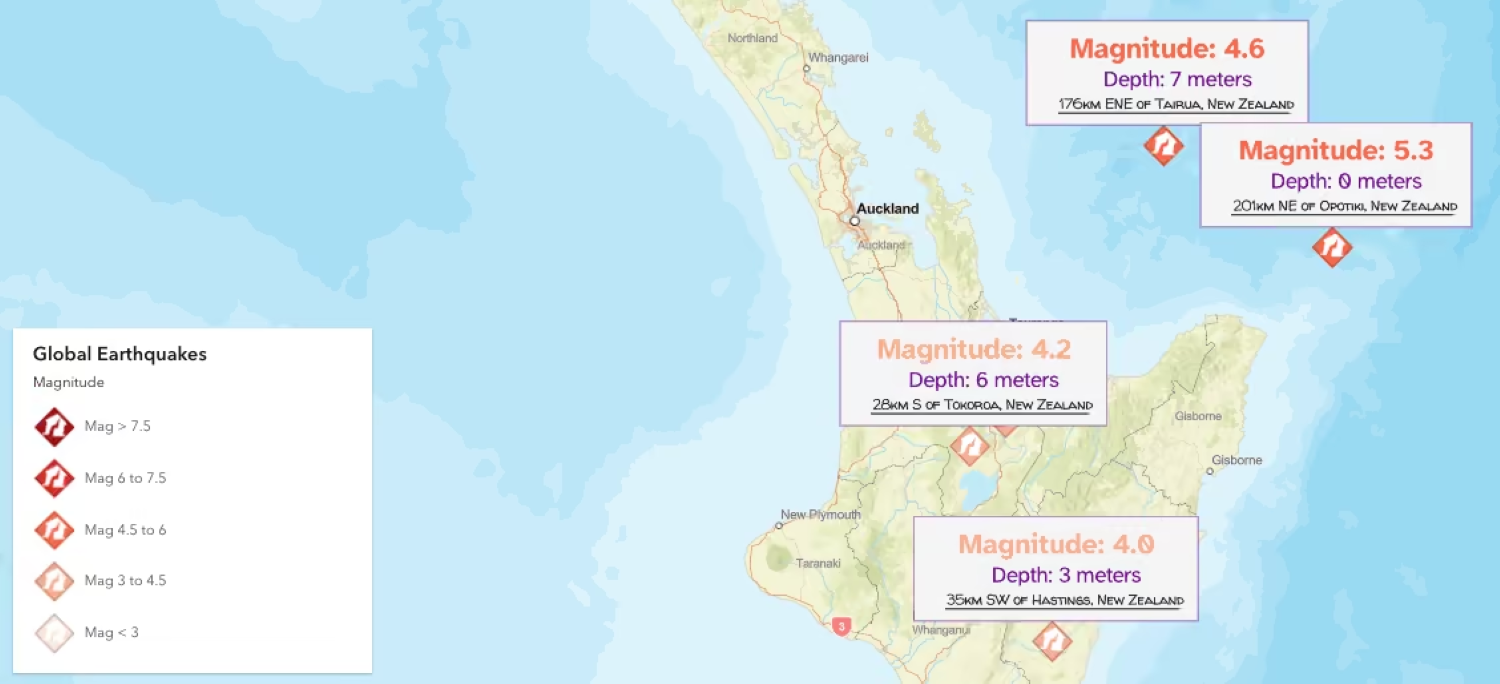
Build time-aware experiences with the new Time Bar
The TimeBar component replaces the TimeSlider widget and component with a configurable set of controls for time-aware applications. Playback controls, a time-extent label, settings, and an optional TimeBarSlider can be combined into layouts ranging from a single play button to a complete time-navigation experience.
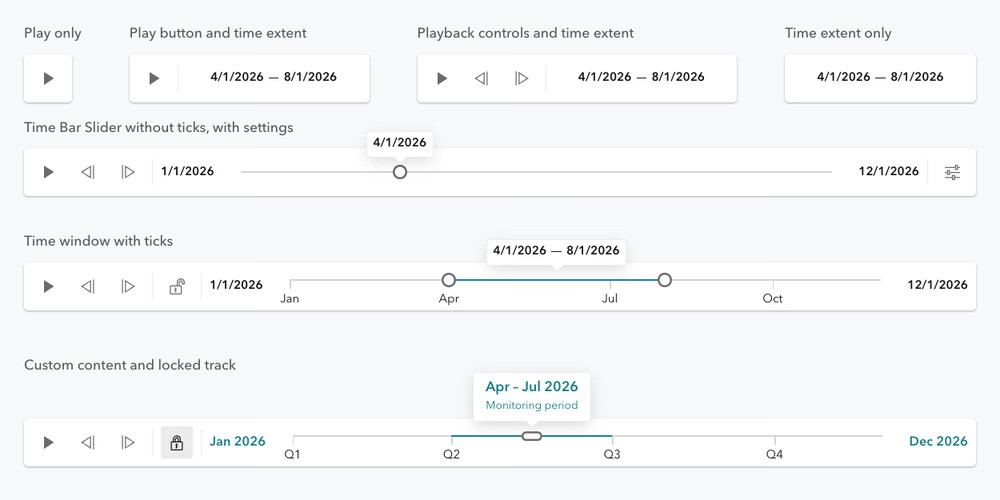
The slider supports date or range selection with configurable labels, ticks, and popover content. Slots also let you incorporate application-specific actions alongside the time controls.
Create, save, and share sketches (beta)
SketchLayer (beta) replaces the deprecated MapNotesLayer and is similar to a GraphicsLayer, but adds support for saving sketch graphics in a web map. Users can create graphics using the Sketch component or you can create them programmatically and add them to the layer’s graphics collection.
When you save a web map, its sketches persist with it. Users can share the web map and continue working with those sketches in Map Viewer. Sketches stored in existing web maps can also load as SketchLayer content in your app by enabling the sketch-layer-enabled flag.
Analyze Gaussian Splat layers
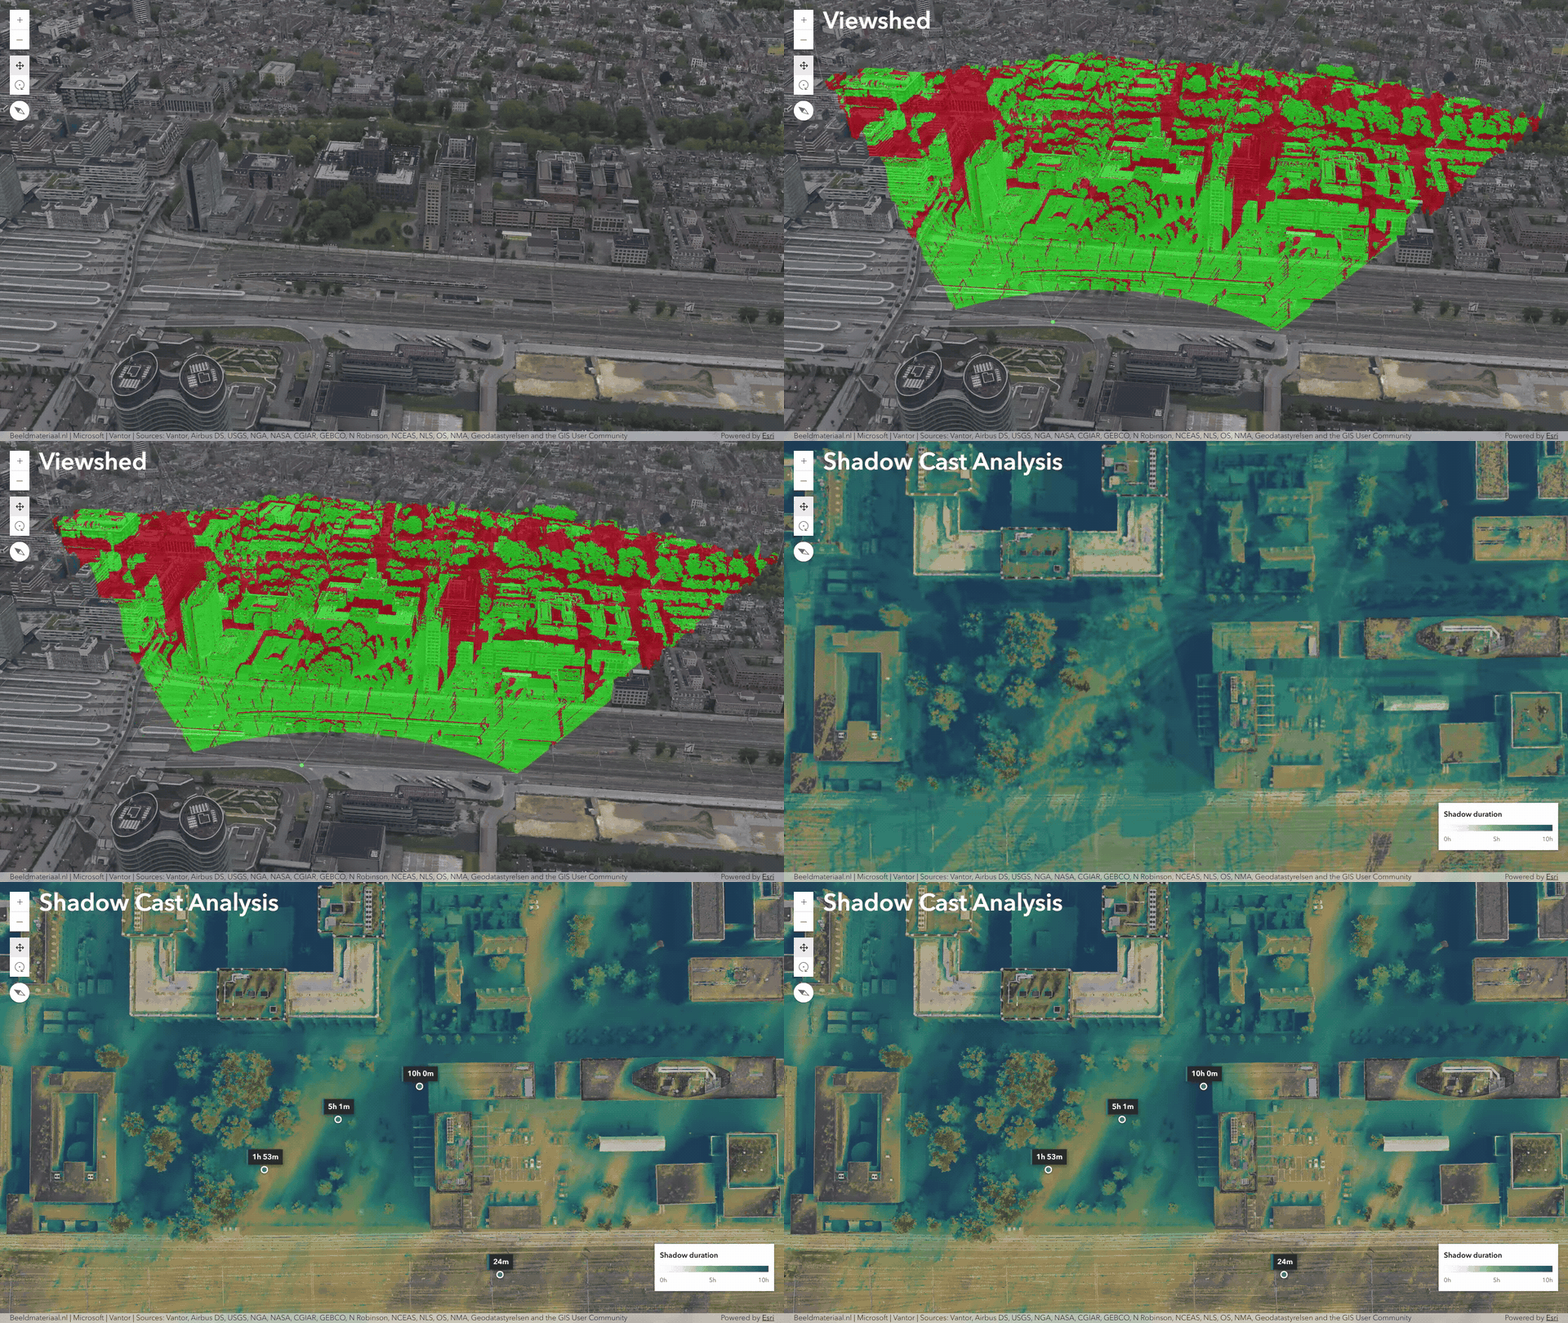
Gaussian Splat layers enable you to visualize highly realistic, complex geometry of built and natural environments in a 3D scene. This realistic layer type has been evolving over the last few releases, with support for a range of analysis types and more complete integration into the scene such as participation in scene shadows. Version 5.2 adds support for Viewshed and Shadow Cast analysis.
Display geospatial PDFs in maps (beta)
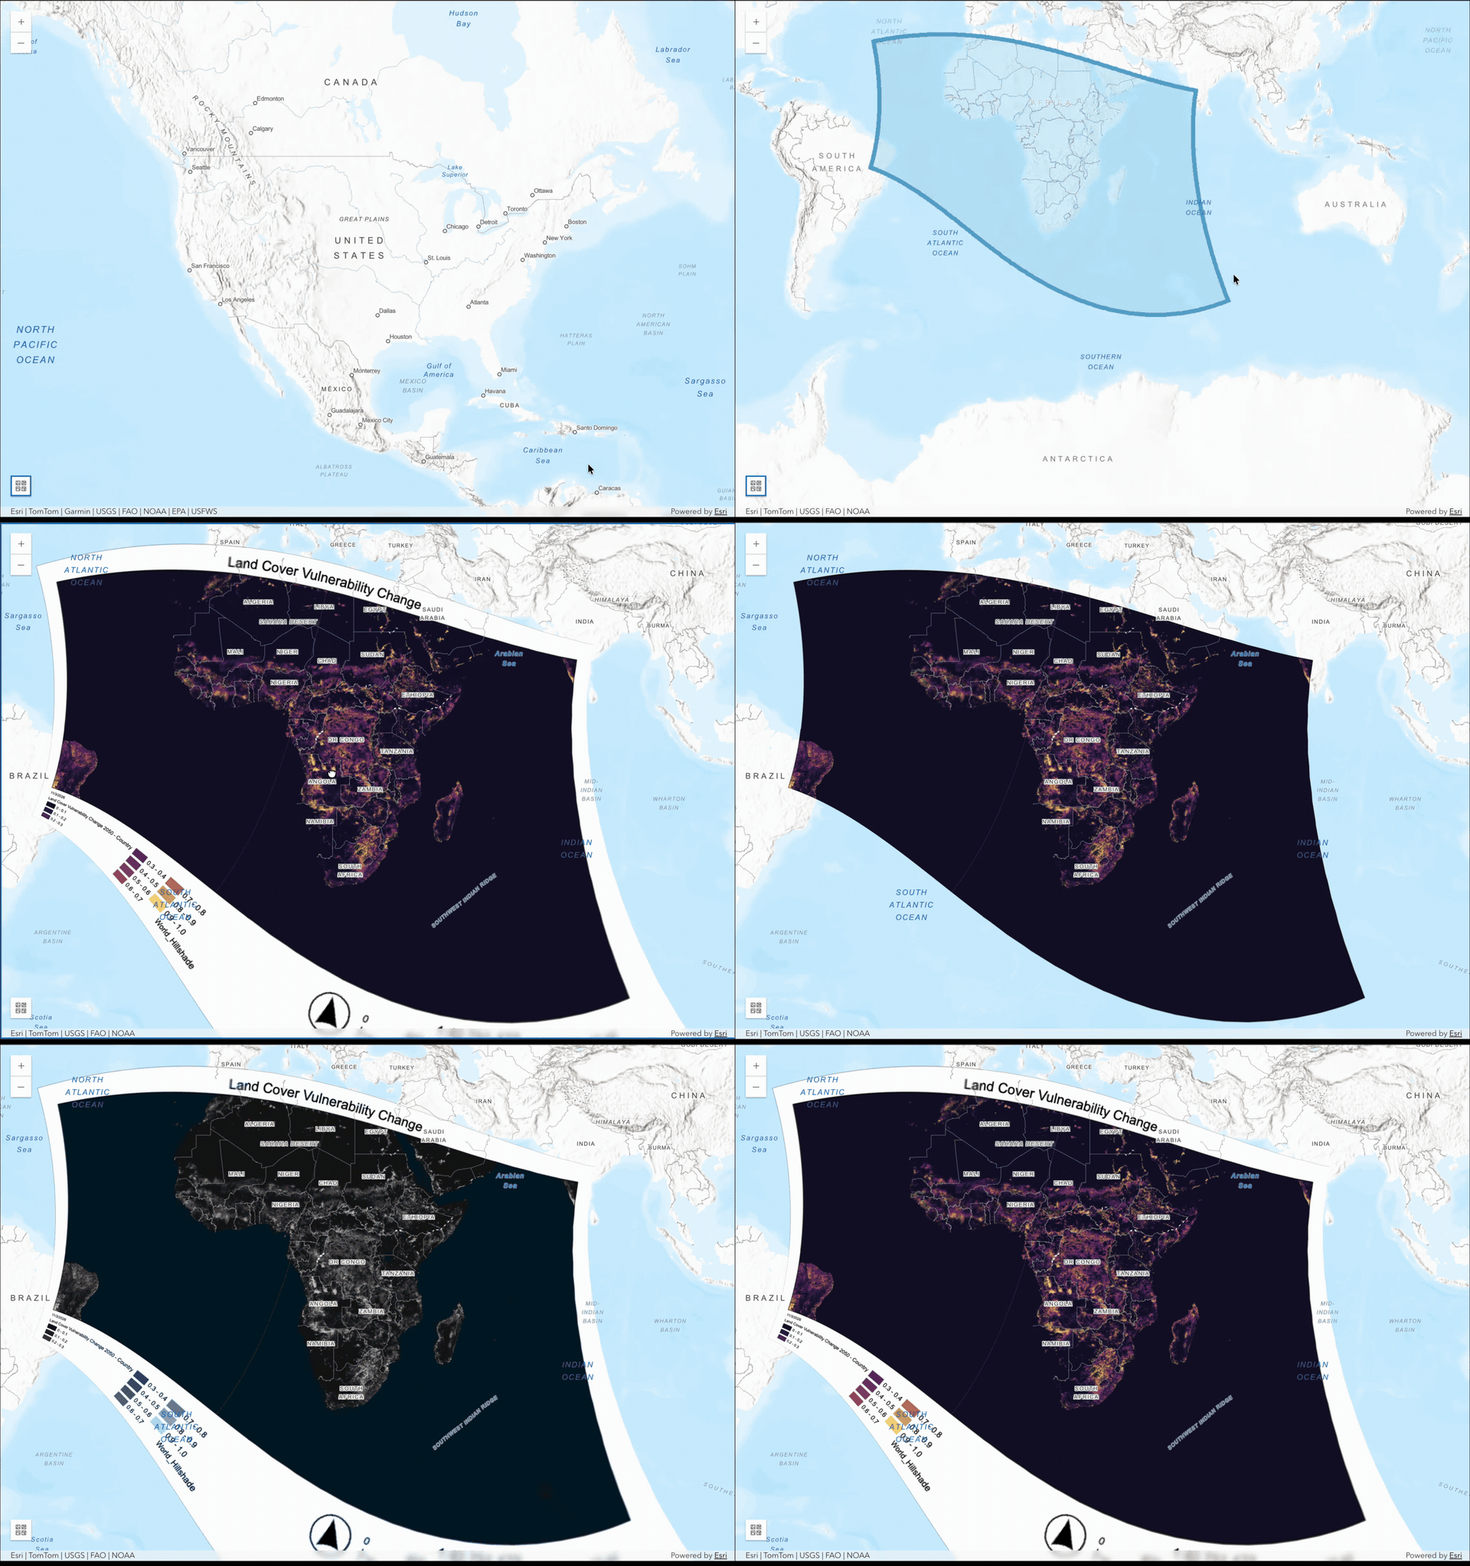
The new GeospatialPDFLayer (beta) brings georeferenced PDFs such as scanned historic maps, incident and emergency response maps, and operational documents into web applications.
The layer displays georeferenced PDFs as raster imagery using spatial metadata embedded in the document. A PDF can serve as a basemap, overlay another basemap, or appear as standalone map content. Client-side reprojection supports PDFs created in a different spatial reference without preprocessing.
Apply new symbology capabilities
Version 5.2 expands CIM symbology with halos, circular-sector effects, animation updates, and 3D visualization with real-world sizing, and additional line patterns.
Halos: A halo can surround an entire CIMPointSymbol, including multilayer symbols, to visually separate it from underlying map content.

Circular-sector effects: CIM symbols support circular-sector effects for directional symbols and pie chart-like graphics driven by feature attributes.
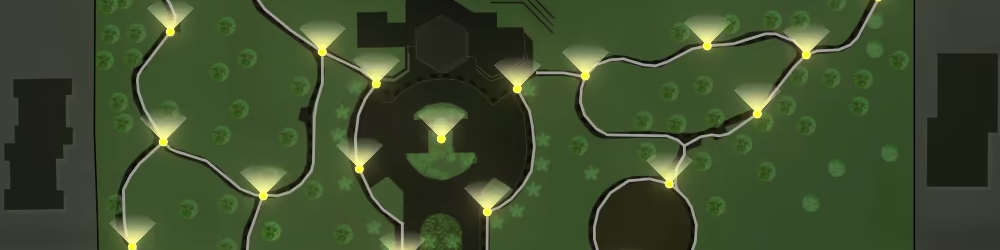
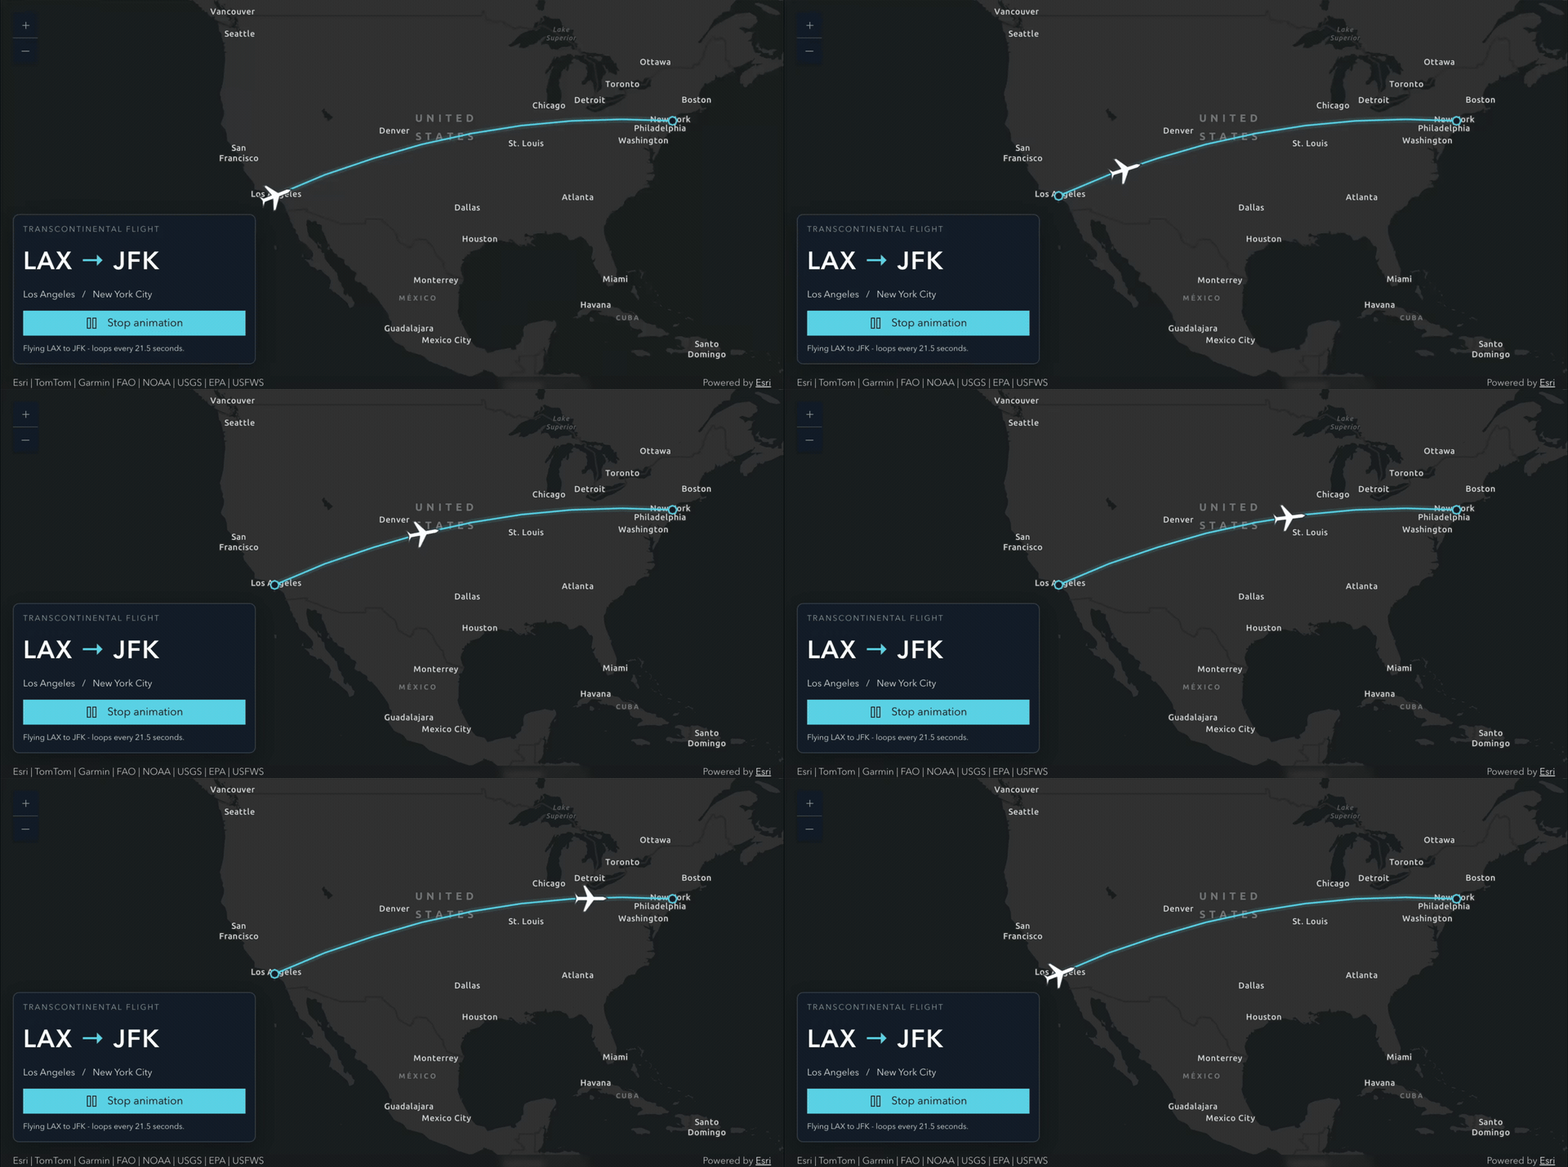
Animate along a line: CIM animations along a line are no longer in beta. You can animate a single marker along a line in 2D, with improved rendering at tile boundaries and smoother continuous movement.
Size and pattern 3D lines: In 3D, line widths can represent real-world meters. A new line-template pattern supports precise dash and gap sequences for road markings and other patterned lines.
Use Google Photorealistic 3D basemap (preview) in custom apps
The Google Photorealistic 3D basemap provides a 3D mesh textured with high-resolution imagery in many cities and populated regions across the globe. With version 5.2, labeled and unlabeled variants can be loaded in self-hosted applications. End users must sign in to an ArcGIS Online organization that has enabled the basemap and the application’s referrer.
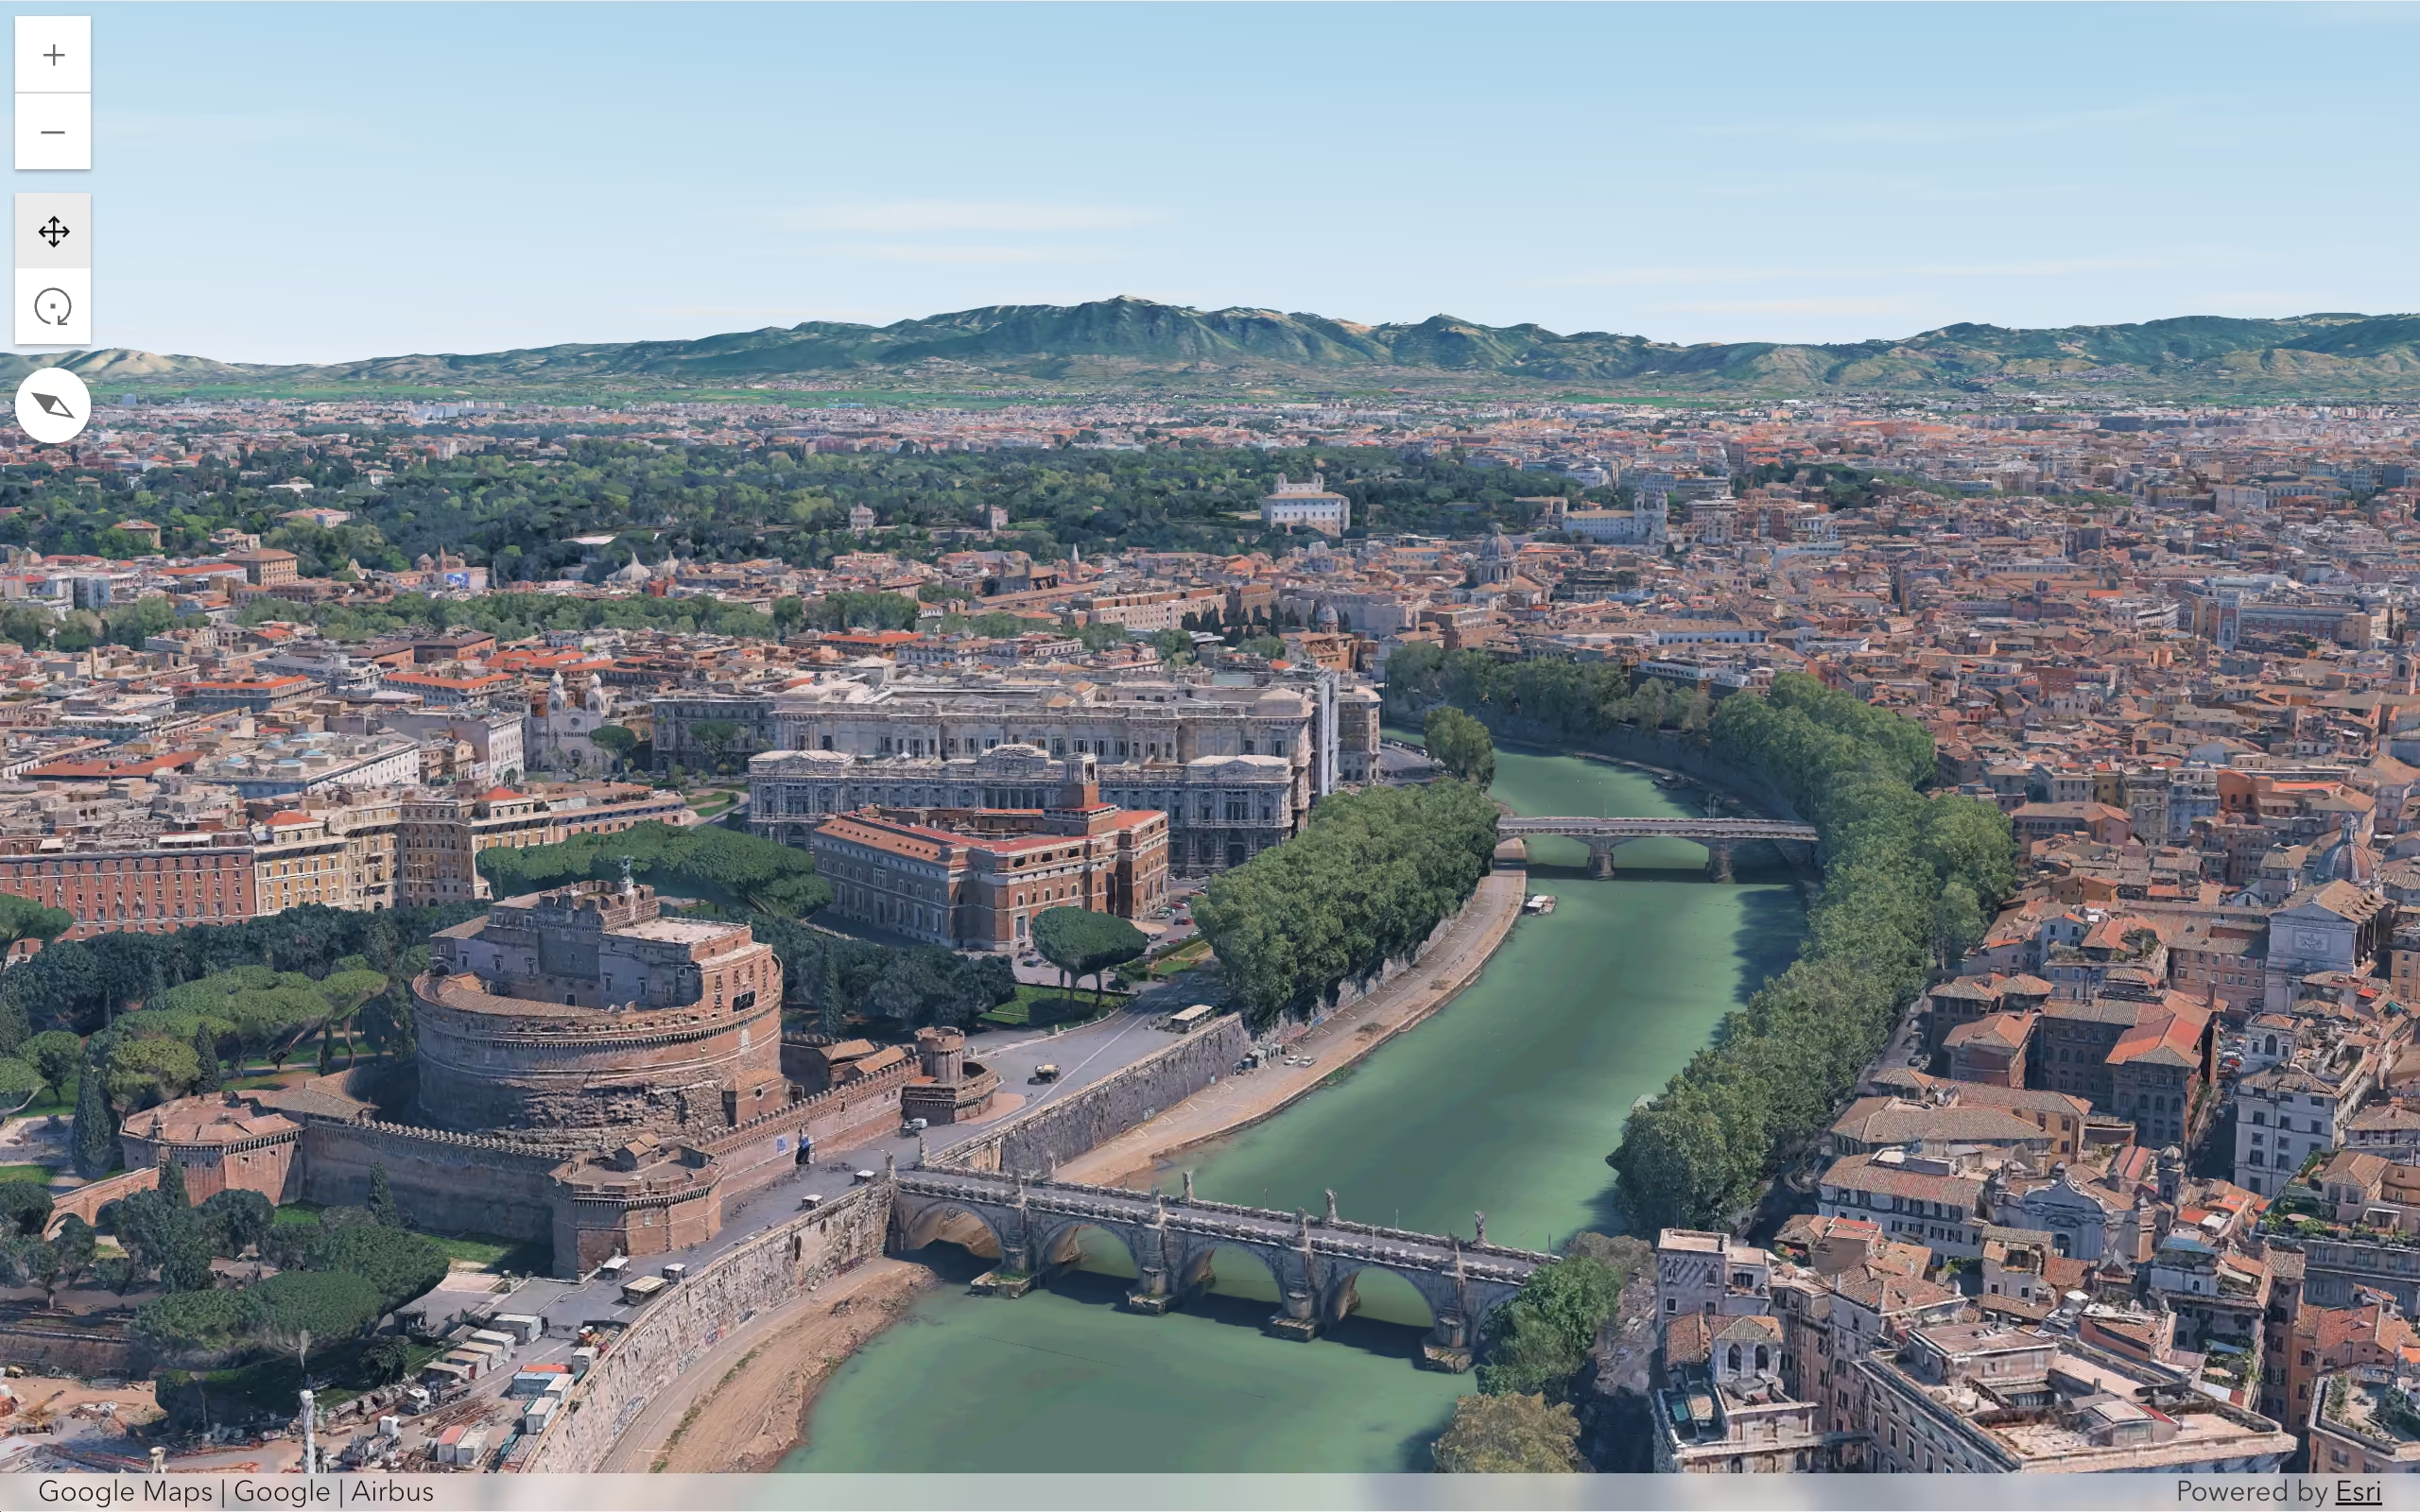
Raster layers can also be draped over the basemap, allowing environmental, analytical, and operational raster content to appear within the 3D environment. Tiled variants are not currently supported.
Build accessible web mapping apps
Version 5.2 introduces keyboard map interaction, assistive-technology support, and attribution contrast across mapping experiences, among other accessibility updates.
Navigate maps and explore features via keyboard: As part of our ongoing work to make mapping experiences more accessible, Map, Scene, and Link Chart components include a keyboard-accessible focus region. Users can move and resize the region, explore data within it, and open feature popups without using a mouse. The interaction is built into the view components.
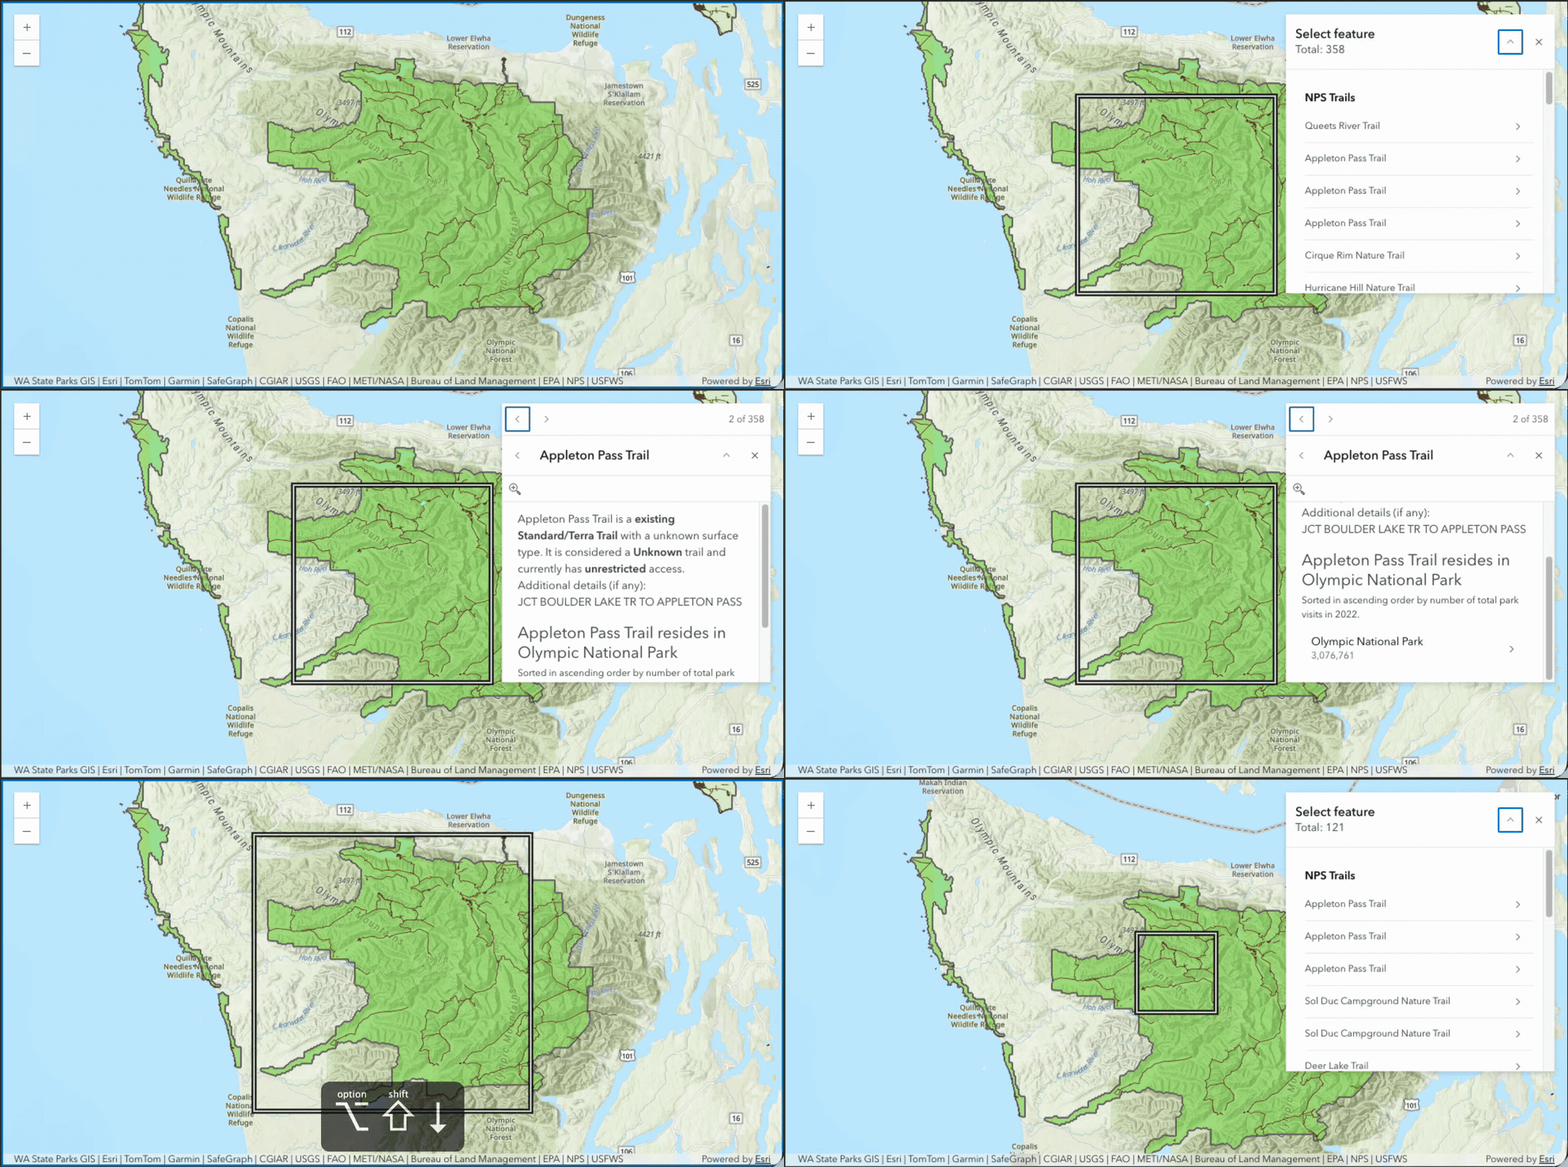
Better keyboard navigation: Keyboard navigation in maps and scenes now supports smaller and larger pan increments as well as diagonal movement.
Improved contrast for attribution: The contrast of text has better readability and accessibility across different map backgrounds.
Try out new and enhanced components!
Version 5.2 adds capabilities across map and chart components, including custom Popup actions, combined analysis tools, Expand behavior, declarative charts, and the new Value Picker component.
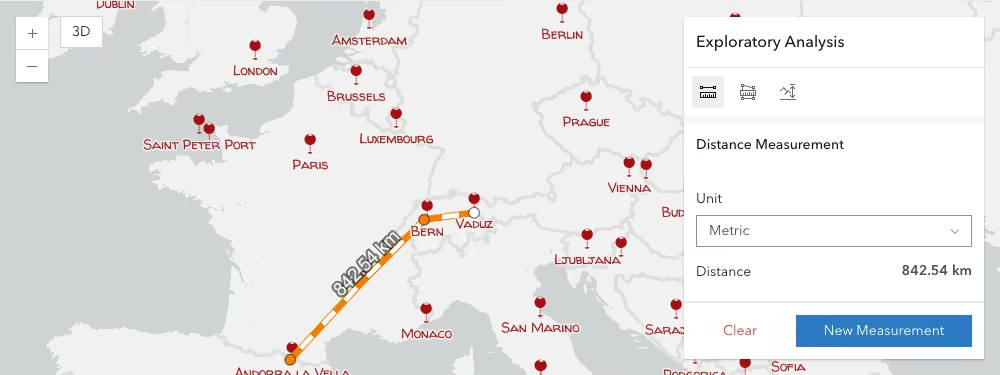
Combined measurement and analysis tools (beta): The new Exploratory Analysis component provides a container for measurement and analysis components, displaying one active tool at a time. Add supported analysis components as children to create a toolbar for switching between tools.
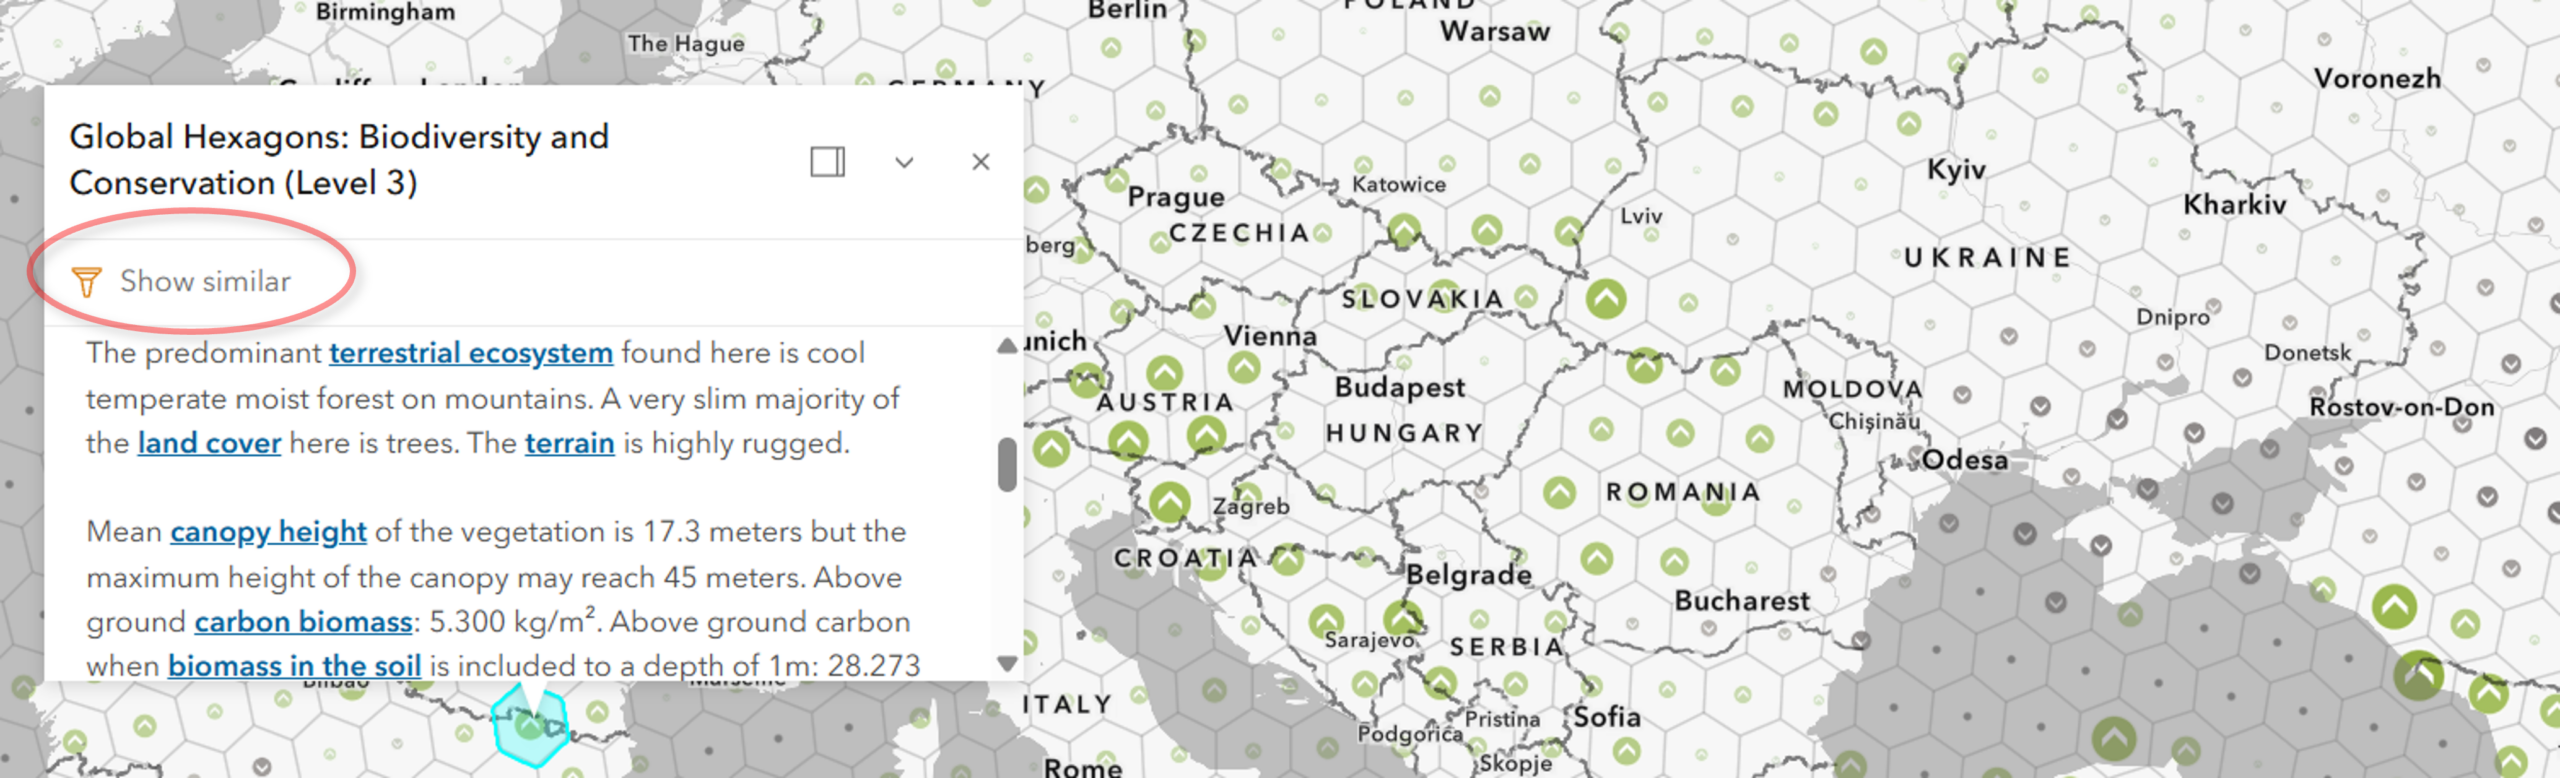
Popup slots: Popup and Features (Next) include action slots for adding custom Calcite actions or action groups alongside, or in place of, default popup actions. By using these slots as opposed to the traditional popup custom actions, you have control over their placement, order, styling, and grouping within the components.
Keep maps interactive with Expand: Expand includes an option to disable modal behavior in mobile or drawer mode, allowing users to continue interacting with the map while the component remains expanded. This behavior will become the default in version 6.0.
Load charts from web maps in HTML: Preconfigured charts stored in web maps can be loaded and displayed declaratively by using referenceElement and mapLayerId to reference the associated map layer.
New Value Picker component: With this new component, users can step or play through a set of data. The component consists of a play/pause button, a next button, a previous button, and the option to include other methods of selecting values such as using a slider or combo box. It replaces the arcgis-value-picker-legacy and its predecessor, the ValuePicker widget.
Work with your data in 3D with better visual quality
Version 5.2 expands nighttime visualization and lighting in 3D scenes with a deep-sky background, atmospheric interactions with light emitters, Global Illumination, and emissive lighting.
The deep-sky background includes the Milky Way in nighttime and globe-scale 3D scenes when stars are enabled.
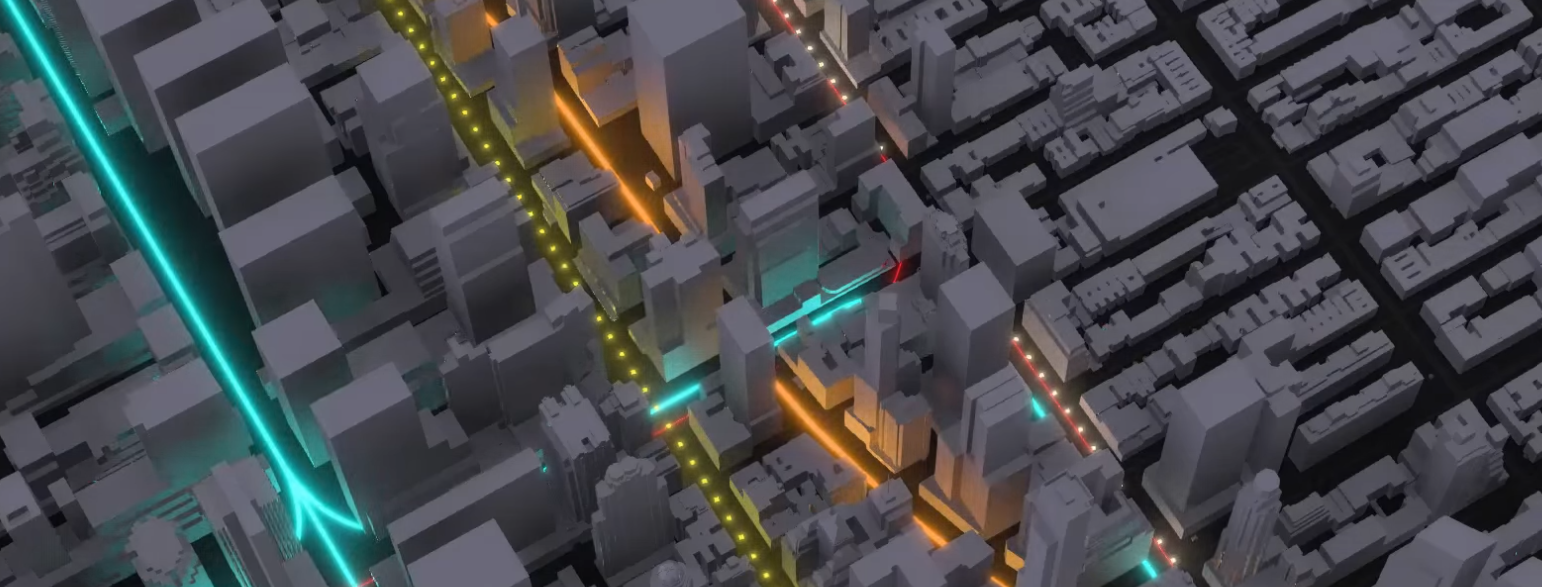
Ambient occlusion darkens areas where surrounding geometry reduces ambient light. It adds detail and definition to geometry and can improve depth perception, for example, by darkening streets between tall buildings.
Emissive lighting brightens areas around emissive materials. Streetlights, illuminated buildings, and glowing symbols can cast light onto their surroundings in nighttime scenes, and tint the surrounding atmosphere under cloudy, rainy, snowy, and foggy conditions. Distant emitters soften and fade, while emissive materials interact with focus areas and analysis tools.
Display, manage, and share dimension and annotation layers
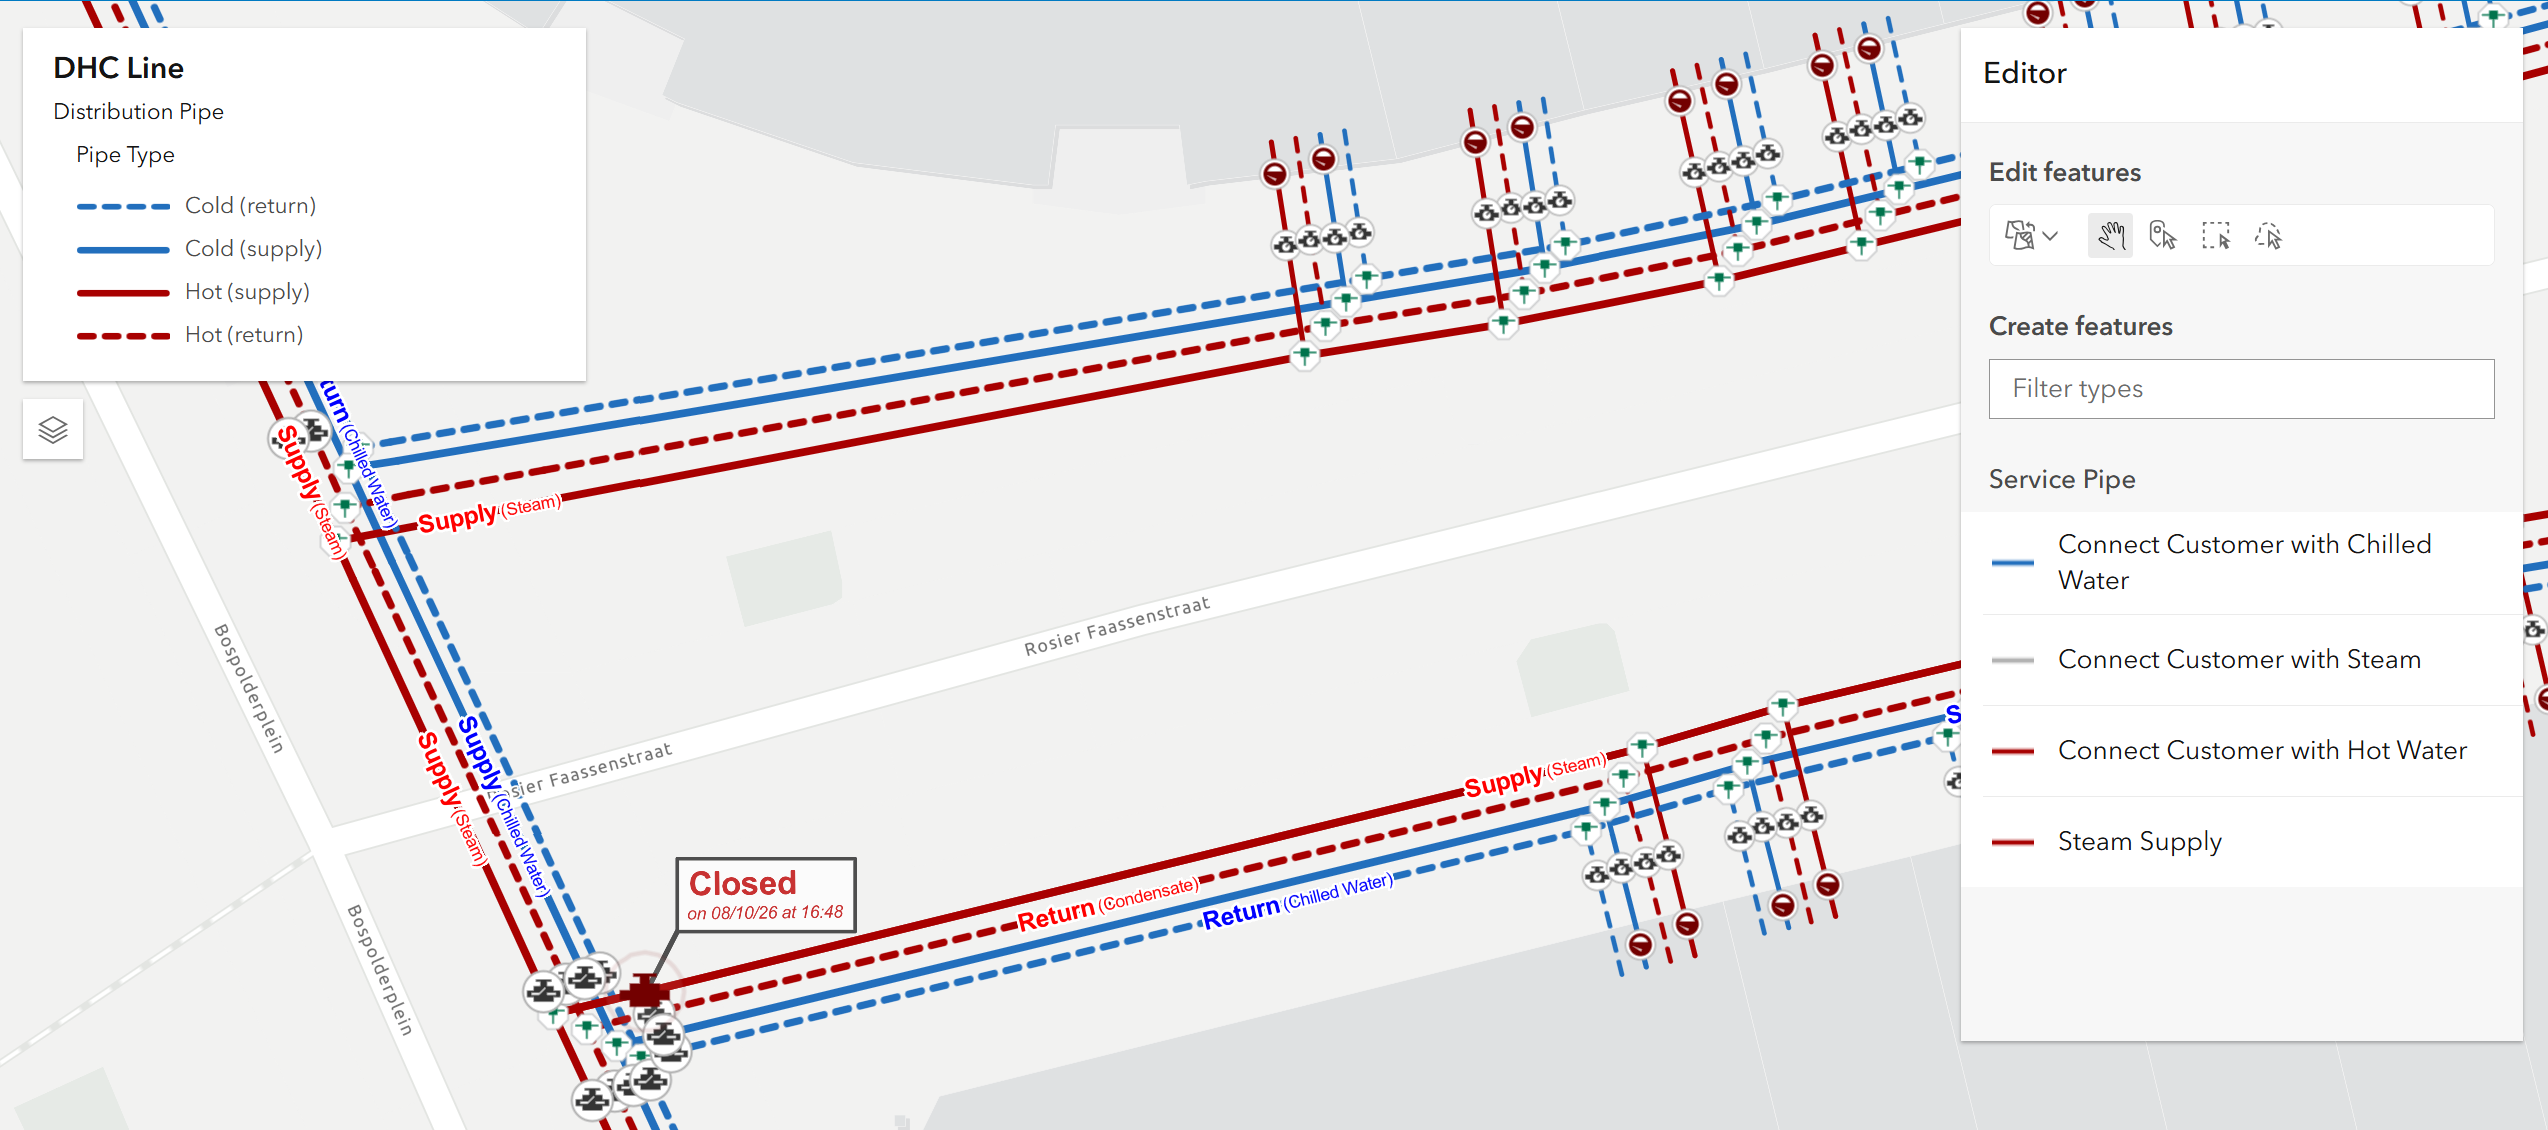
Annotation and dimension layers now support additional workflows for displaying, managing, and sharing. You can save annotation and dimension layers as portal items, display linear dimensions using units defined in dimension styles, and use callouts and formatted text in annotations. You can also view annotation and dimension layers in feature table, with editing support planned for a future release.
Enhanced visibility analyses
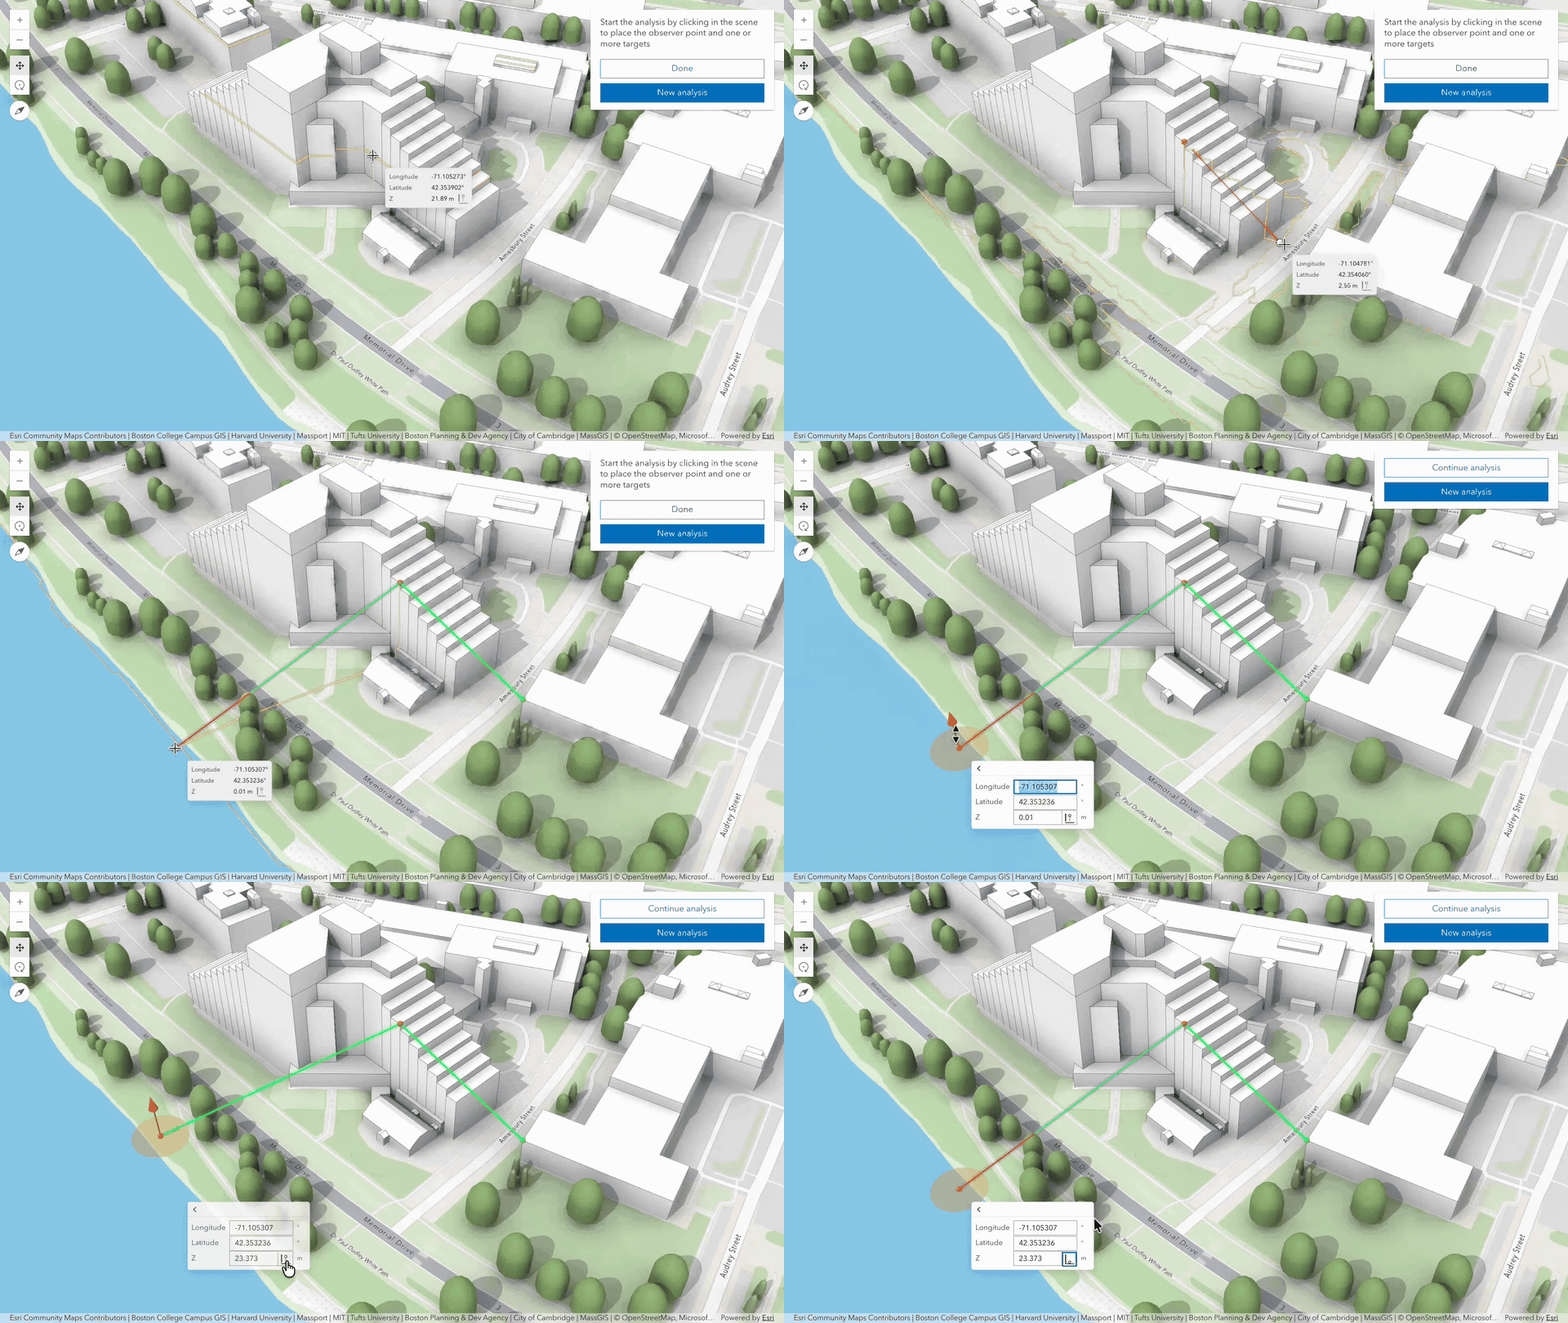
This update improves the placement and editing experience for interactive viewshed and line of sight analyses. New tooltips and snapping capabilities provide greater control when positioning observers and targets. Tooltips now support elevation mode selection, making it easier to adjust the vertical position of points.
Simple math expressions in tooltips
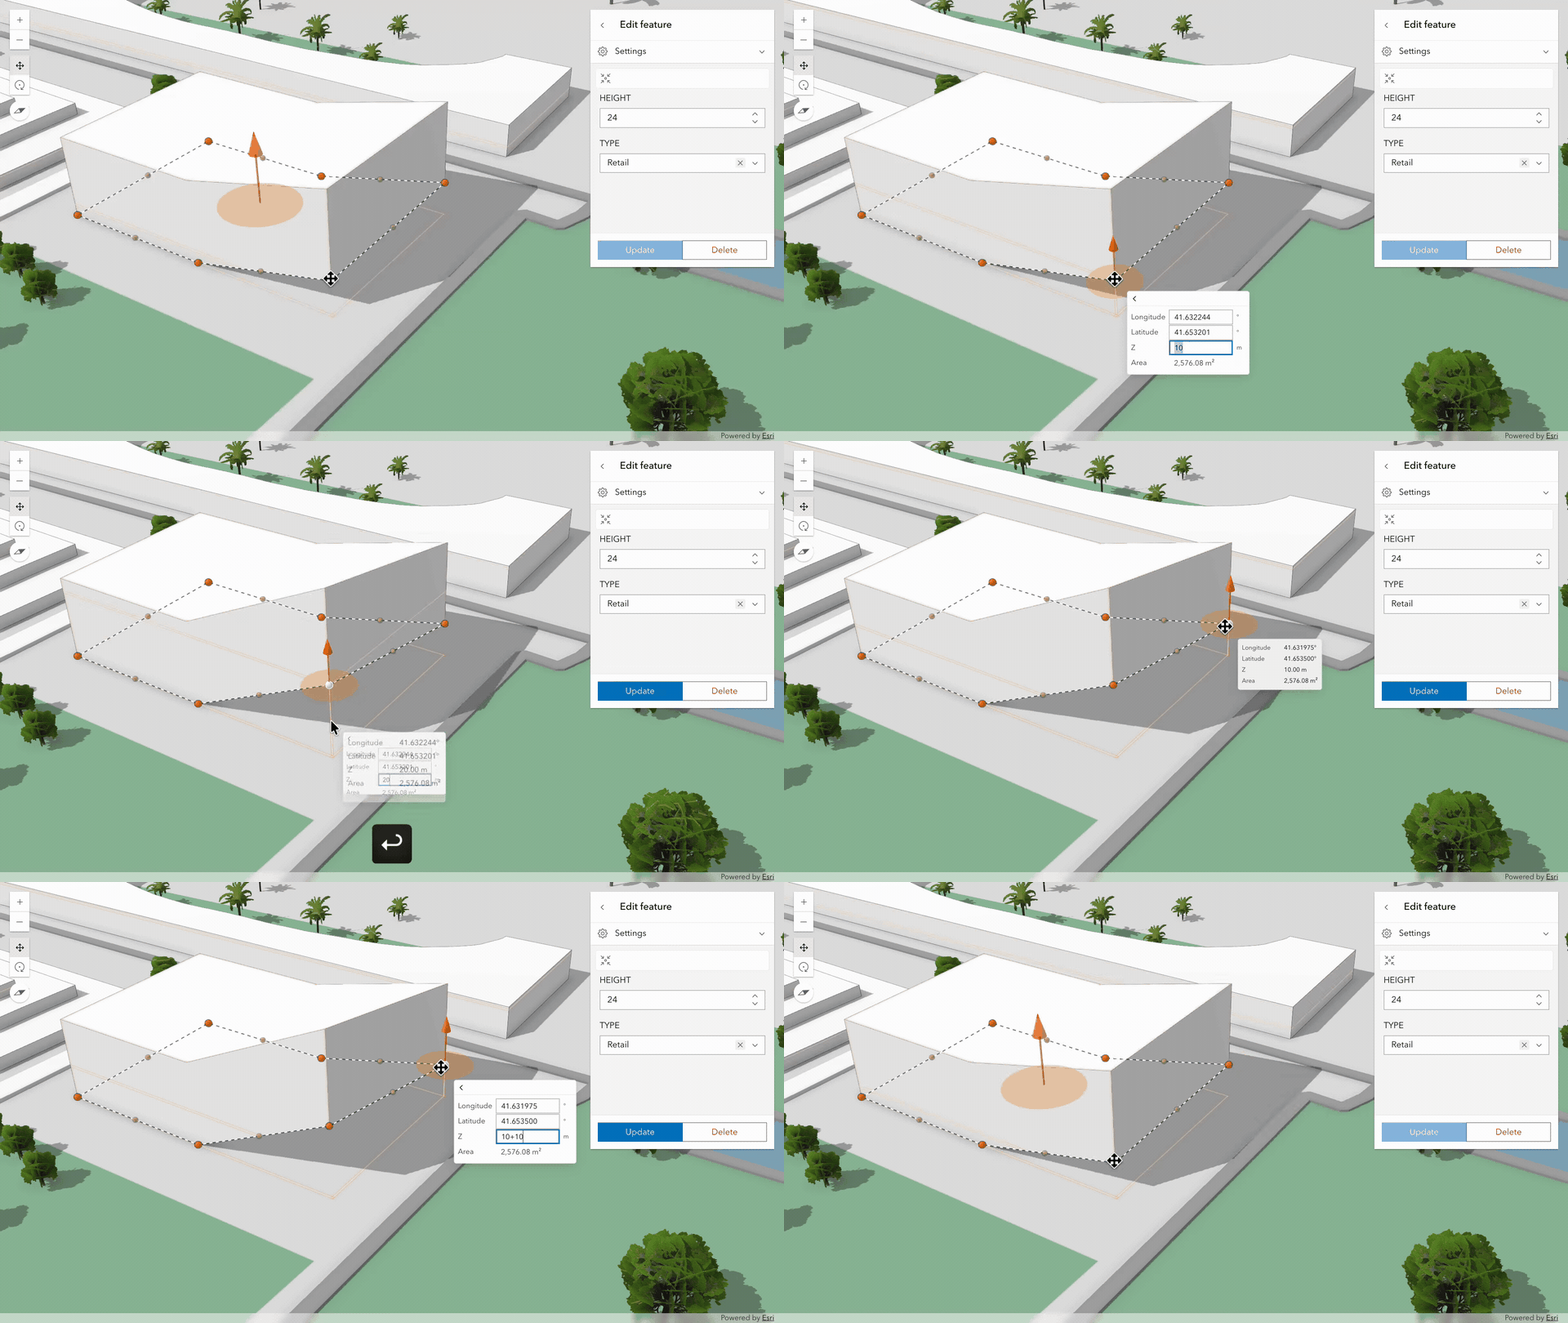
Tooltips in sketching, editing, and visibility analyses now support simple math expressions, such as +1.5 or -25. This enhancement makes it easier to adjust the X, Y, or Z positions of features, vertices, observers, and targets with greater precision.
Explore additional 5.2 updates!
These highlights cover only part of the 5.2 release – there is a lot more to discover, for example:
- Time zone support in web scenes, providing consistent support across 2D and 3D.
- Feature highlighting based on attribute or spatial filters, such as features within two miles of a moving pointer.
- Area-based feature retrieval in 3D scenes, extending the capability introduced for 2D in version 5.1.
- Parquet feature layer support in Charts components and a new radar chart.
For the complete list of updates, see the 5.2 release notes and explore the 5.2 samples.
Preparing for version 6.0
The SDK follows semantic versioning, with one major release each year for breaking changes and two minor releases that add backward-compatible functionality. The next major release, 6.0, is planned for Q1 2027.
Version 6.0 will remove most deprecated APIs, including widgets, deprecated view models, and UI capabilities from MapView, SceneView, and LinkChartView, including the popup and view UI.
Start preparing now: migrate from widgets to components and from MapView, SceneView, and LinkChartView to the recommended arcgis-map, arcgis-scene, and arcgis-link-chart components. Review the migration guidance and updated programming patterns as you prepare for 6.0.

Commenting is not enabled for this article.