Hello developer community! We are excited to connect with you virtually next week at the 2021 Esri Developer Summit! We’ve been hard at work preparing for this event and there is no shortage of innovative demos, technical sessions, and ways of connecting directly with the development team. This blog serves as a brief overview of the DevSummit event for anyone wanting to expand their web mapping & development expertise.
Highlights of the last year & how to plan your week
As with previous years, we have a session dedicated to helping attendees sift through a wide variety of technical sessions and plan their week. However, we’re shaking it up this year! This time, it will be a combination of “What’s New” and an overview of sessions happening throughout the week. Each presenter will have a few minutes to cover key enhancements for their topic area, and then give you a sneak peek of their sessions and demos. This is a great way to quickly get an update on the API, as well as figure out which topics you want to learn more about.
ArcGIS API for JavaScript: Key Highlights of the Last Year (Live)
Visualization techniques
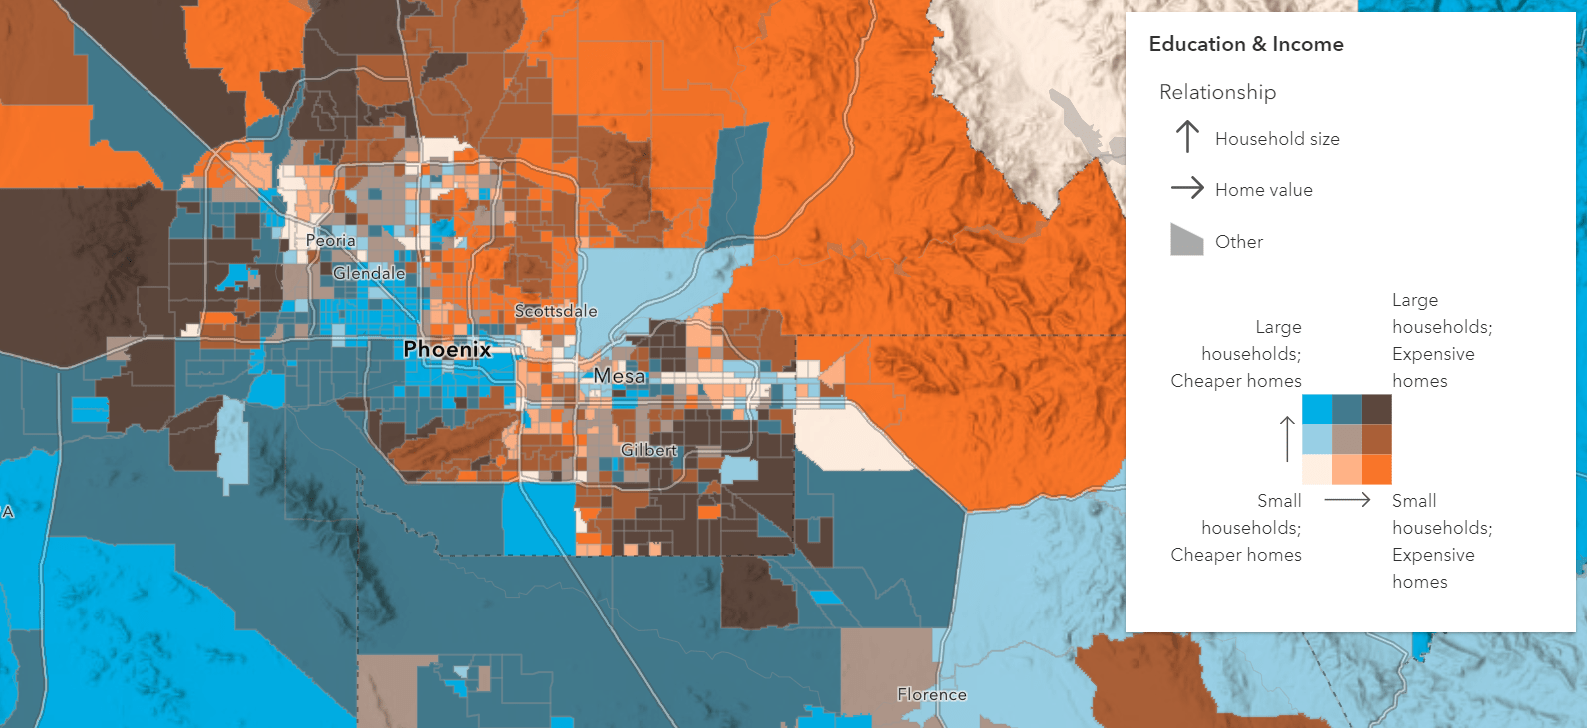
2020 was a crazy year when it came to visualization. The world used web mapping to help communicate about the pandemic and act on unprecedented challenges at a magnitude that we’ve never seen. Developers built incredible applications and managed services that served trillions of people. In the same year, we expanded the API with new ways to tell the story behind your data, and create striking, interactive workflows. We are offering a collection of sessions that cover both the traditional and brand-new ways of visualizing your data, techniques for enabling dynamic workflows, and best practices.
ArcGIS API for JavaScript: Dynamic Vector Symbology (Streaming Live)
ArcGIS API for JavaScript: 2D Visualization (Streaming Live)
ArcGIS API for JavaScript: 3D Visualization (Streaming Live)
ArcGIS API for JavaScript: Data-driven Animations (Streaming Live)
Best Practices for Building Web Apps that Visualize Large Datasets (Streaming Live)
ArcGIS API for JavaScript: Using Arcade with Your Apps (Streaming Live)
ArcGIS API for JavaScript: Case Studies of Immersive Apps for Exploring Data (Streaming Live)
ArcGIS API for JavaScript: Clustering (On-demand)
ArcGIS API for JavaScript: Building Custom Visualizations Using WebGL in 2D Map Views (On-demand)
ArcGIS API for JavaScript: Working with Your Data Using the Feature Layer (Streaming Live)
ArcGIS API for JavaScript: Photoshop-style Graphics Effects for Your Layers and Data (Streaming Live)
Session highlight: ArcGIS API for JavaScript: Photoshop-style Graphics Effects for Your Layers and Data
For many years, cartographers created stunning printed maps by authoring a map in ArcGIS and then using a digital imaging application like PhotoShop to apply interesting effects on layers and create blending between layers. Now developers can use those same techniques on live, dynamic maps using the JavaScript API. This session is all about the new blend modes and layer effects which will allow you to create new experiences or take your existing applications and make your maps pop in new ways.
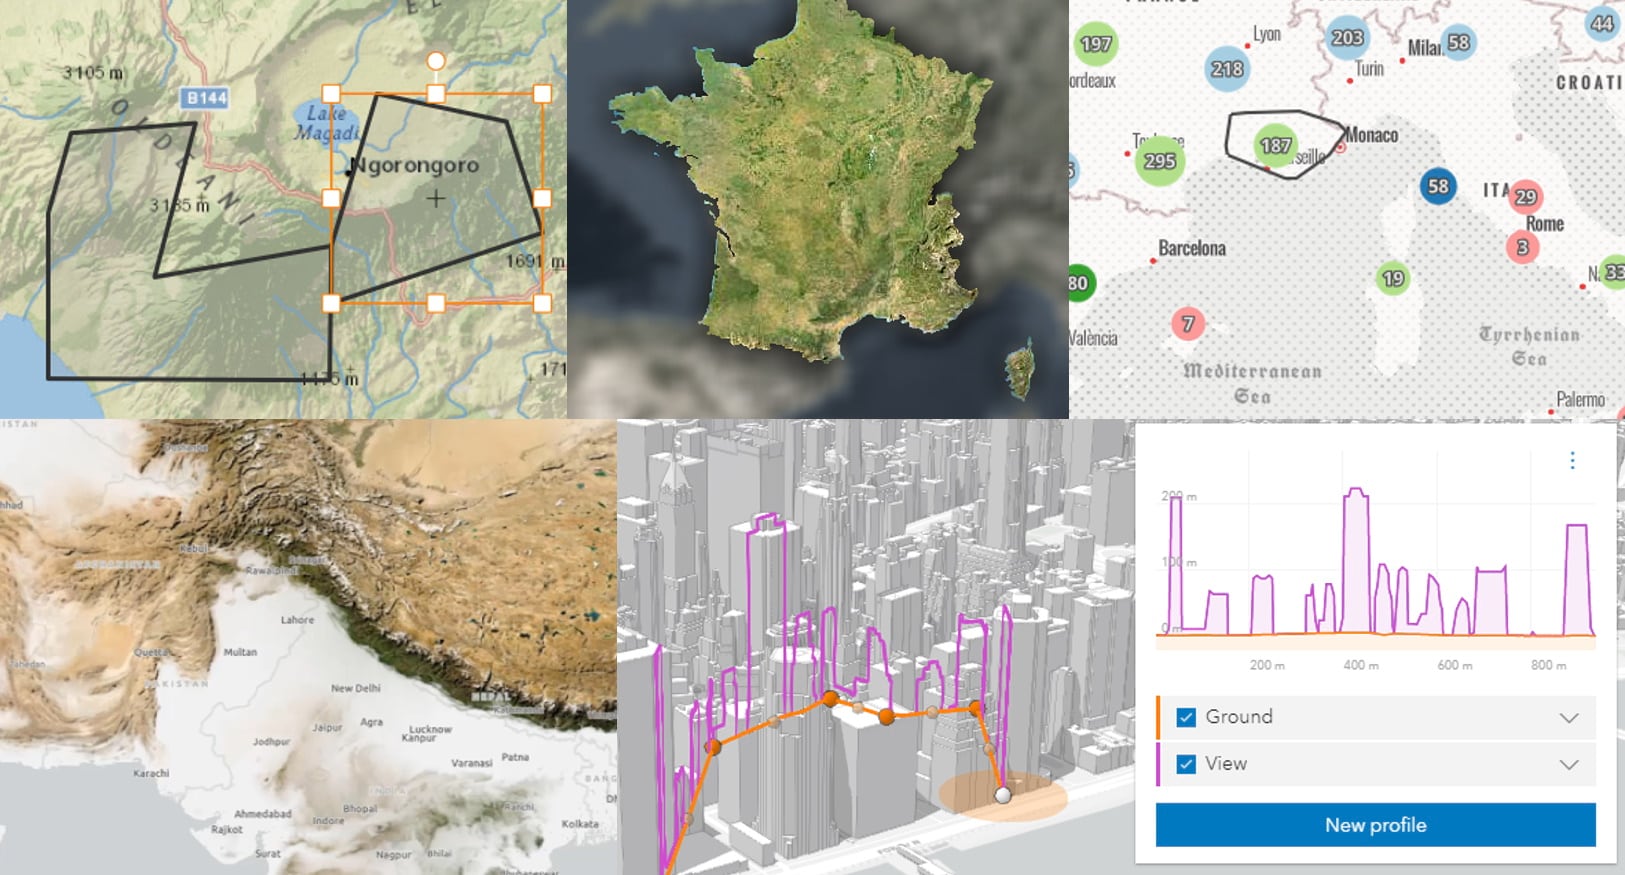
Client-side analysis
The JavaScript API allows you to perform client-side queries, calculate statistics, filter, and do geometric analysis with seemingly instantaneous performance. Because it isn’t making a trip to the server to do this processing, you can create very powerful 2D and 3D applications with workflows that weren’t possible in the past. The following sessions cover client-side analysis; from real-time data feeds to working with hosted tiled imagery to analytical techniques and programming patterns in 2D and 3D.
ArcGIS API for JavaScript: Client-side 3D Analysis (Streaming Live)
ArcGIS API for JavaScript: Client-side queries, filters and analysis (without a server) (Streaming Live)
ArcGIS API for JavaScript: Real-time Data Visualization and Analytics (Streaming Live)
ArcGIS Online Imagery: Working with hosted imagery using the ArcGIS API for JavaScript (On-demand)
Build the right experience
Editing. 2020 was a big year for the JavaScript API’s editing capabilities. You can now create web editing apps in 2D and 3D using the API’s widgets with minimal code. Recent advancements include the popular snapping capability. To learn more, attend these sessions:
ArcGIS API for JavaScript: Web Editing in 2D (Live)
ArcGIS API for JavaScript: Web Editing in 3D (Streaming Live)
Widgets. The API’s widget architecture consists of a clean separation between the presentation (UI) of widgets and the underlying business logic. This gives you the ability to easily use the widgets as-is, customize the look and feel, and even integrate your own custom workflows into the widget using events. The following two sessions will cover how you can build your own widget from scratch using the API’s development pattern, and how you can customize the API’s widgets.
ArcGIS API for JavaScript: Building Your Own Widget (Streaming Live)
ArcGIS API for JavaScript: Customizing Widgets (Streaming Live)
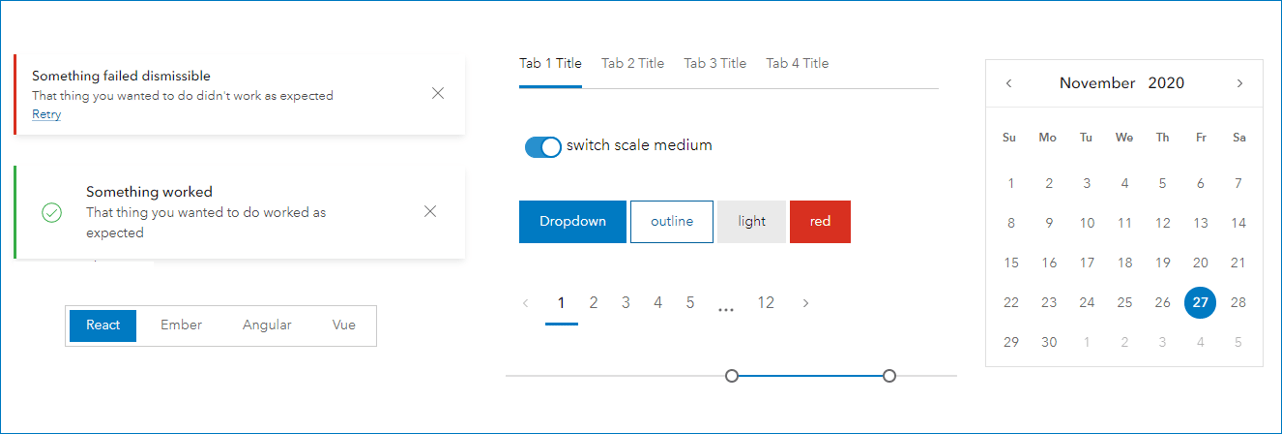
Design system. This month we are releasing Calcite, Esri’s design system, so that developers can create consistent, beautiful apps that have a smooth integration with the ArcGIS ecosystem. We have a collection of sessions that will provide a tour of the resources available (web components, icon library, colors & themes, and design guidelines/best practices), teach you how to use the resources in your app through code examples and demonstrations, and discuss resources available for designers (UI kit, etc).
Esri’s Design System: Build Beautiful, Consistent Web Apps Faster (Live)
Esri’s Design System: Build Compelling Web Apps Faster Using the New Web Component Library (Live)
Esri’s Design System: Designing Applications Faster with UI Kits and Components (Live)
Development tools & techniques
Consuming the API & JS frameworks. In December, we released an additional way of consuming the API – ES modules, in beta. Now at version 4.19, we are introducing the production release. This will enable easy integration with modern frameworks and build tools. The following sessions will cover the various ways in which the API can be consumed in your app, and everything you need to know about integrating with the most popular JS frameworks.

ArcGIS API for JavaScript: Building Apps with ES Modules (Streaming Live)
ArcGIS API for JavaScript: Building Apps with React (Streaming Live)
ArcGIS API for JavaScript: Options for Consuming the API (Streaming Live)
ArcGIS API for JavaScript: Building Apps with Angular (Streaming Live)
To learn about tips & techniques for building progressive web apps with optimal performance, tooling and best practices for enterprise development, and TypeScript, attend the following sessions:
ArcGIS API for JavaScript: Building Progressive Web Apps (Streaming Live)
ArcGIS API for JavaScript: Using TypeScript (On-demand)
Enterprise JavaScript : CI/CD Pipeline (Streaming Live)
Enterprise JavaScript: Test More, Work Less (On-demand)
Getting to know the API
For newbies. The full line-up of sessions will help you get familiar with the JavaScript API capabilities and programming patterns, but if you are brand new to the API and web development, you can watch this session at your convenience:
ArcGIS API for JavaScript: Getting Started with Web Development (On-demand)
Programming patterns. The following session is an overview of the API’s programming patterns and fundamentals; a great session to attend if you have already done some JavaScript development and are new to the API, or after you watched the getting started session above.
ArcGIS API for JavaScript: Programming Patterns and API Fundamentals (Streaming Live)
Using location services. The ArcGIS Platform offers powerful location services which you can consume in web apps built with any client technology. However, the ArcGIS API for JavaScript provides the most expansive, robust integration with these services; making it easy to build high-performing, compelling web applications. To learn how you can start using ArcGIS location services with the JavaScript API, attend this session.
Working with location services using ArcGIS API for JavaScript (Streaming Live)
Under the hood & road ahead
API under the hood. The lead architects of the API will be presenting a session that will reveal the innovation “under the hood” that powers the API. They will share the underlying architecture and ways in which they leverage modern browser technology to deliver an API that dynamically renders more than a million features with fast performance. Their hope is that some developers attending this session might be inspired to apply similar techniques in their own apps.
ArcGIS API for JavaScript: A Look Under the Hood (Streaming Live)
Roadmap. In the following session, we will be demonstrating on-going projects and talking about our 2021 roadmap. Attend this session if you are curious about what we are working on for upcoming releases.
The Road Ahead: ArcGIS API for JavaScript (Live)
A session for asking us anything
We will be covering many topics throughout the week! On Thursday, we will have a session purely dedicated to answering any remaining questions that you have. Starting on the first day of the conference, Tuesday April 6th, you can post your questions in our GeoNet place dedicated to this session and continue to do so for the duration of the conference. We will go through the questions posted here during the session.

ArcGIS API for JavaScript: Everything You Wanted to Know But Were Afraid to Ask (Live)
Connect with us via “Ask our Experts!”
We really miss seeing you in person, but we have a great event system setup that will help us connect virtually. The Ask Our Experts page is the best way to communicate with the ArcGIS API for JavaScript development team and other attendees throughout your conference experience. Engage with us and fellow attendees through direct chats, and exchange contact information to get in touch later.
Looking forward to “seeing” you next week!
Your friends at Esri
Banner photo by Radek Grzybowski on Unsplash

Article Discussion: