Version 4.25 is out and we’re excited to share all of the powerful new capabilities and improvements that the team has been working on! Read on to learn about some of the highlights in the release…
Related records in popups
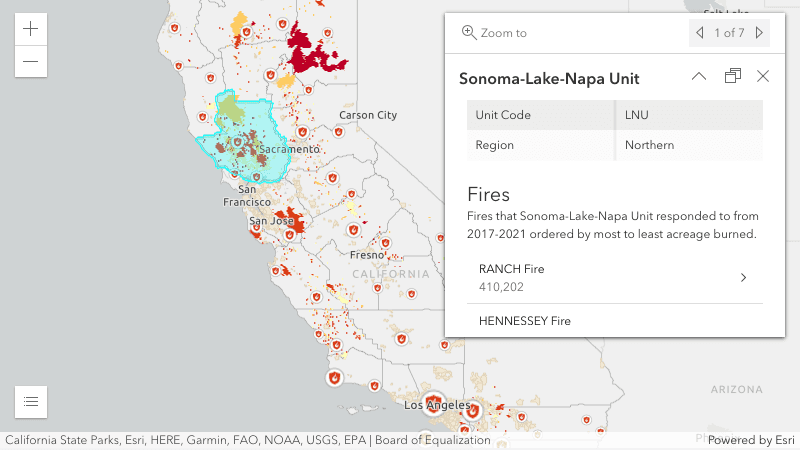
We added support for displaying related records in popups using the new RelationshipContent content type in the popup template. You can design your popup in the same way that you’ve done before with other types such as pie charts and text – either authored in the Map Viewer and saved to a web map or layer or defined in your code. The related layer or table must be added to the map. We will be adding support for editing related records in an upcoming release.
Custom cluster styles
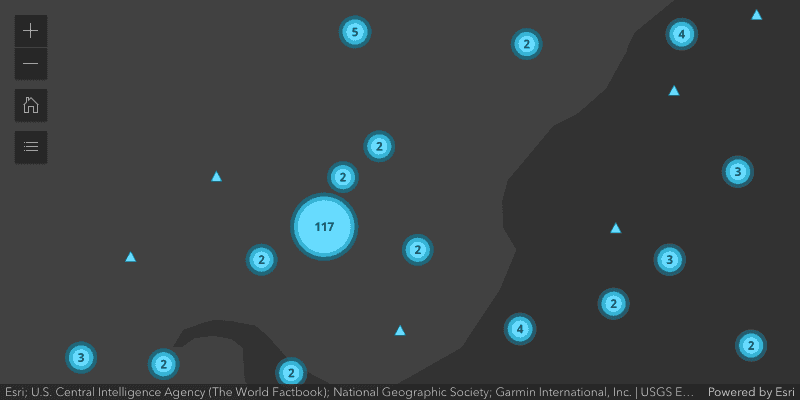
By default, clusters are styled based on the underlying layer’s renderer so that the cluster symbol either represents the average value of the features in the cluster, or the most common category. You can now override the default style of the FeatureReductionCluster using either a unique cluster symbol or a renderer.
Unique cluster symbol: Define a unique cluster symbol while retaining the symbology of individual points defined in the layer’s renderer.
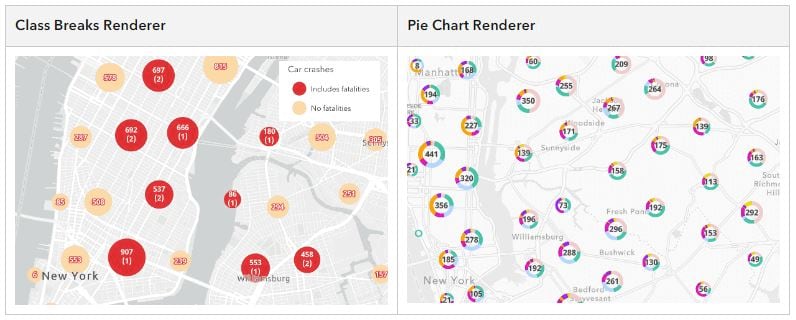
Cluster renderer: Rather than define a single cluster symbol, you can create a custom cluster renderer based on an aggregation of the underlying data, such as the sum or average of a given field. See the Clustering with aggregate fields and the Cluster based on the sum of a field samples to learn how to do this.
One option you have for the renderer is a pie chart, which is a great way to see a breakdown of the data that the cluster represents. See the Clusters as pie charts sample to learn more.
Cloud Optimized GeoTiff (COG) support
This release adds support for adding Cloud Optimized GeoTiff (COG) files to imagery tile layers via the URL property (released in beta). COG files can take advantage of all the capabilities of imagery tile layers.
Full 3D snapping
Snapping in 3D scenes has been enhanced with the ability to snap in all three dimensions to derive complete x, y and z coordinates from existing features. In addition to feature layers, you can snap to features in 3D Object and Building Scene Layers.
Length dimensioning in 3D scenes
A new capability called dimensioning allows you to display length or distance measurements between two points in a 3D scene. This can be done programmatically – for example if you want to show measurements of geometries from another layer – or by allowing the user to interactively manipulate the dimensions associated with a layer. Users can easily dimension existing features through 3D snapping. The dimensions are represented in a new layer type called DimensionLayer which will be included in the legend and layer list widgets just as any other layer and can be saved to and loaded from a WebScene. The dimensions can be used in slides to share with stakeholders, such as for existing and proposed developments.
Terrain shading
We’ve made it easier to perceive structure and shape of the ground in 3D scenes by incorporating a dynamically shaded relief based on sun position. If you are using a vector basemap that doesn’t incorporate a hill shade (like the topographic basemap does) the terrain shading can be a huge improvement to the aesthetic of the scene.
Voxel Layer updates
Drill deeper into the rich data of voxel layers by exploring isosurfaces and dynamically examining horizontal and vertical slices of the 3D volume. There are two approaches to display different isosurfaces:
- For continuous variables, you can define a transfer function to apply normalized color or transparency stops.
- For discrete variables, you can set a color for each variable.
To look inside your data, you can cut vertically through the volumes and slices to carve up the cuboid volume into convex shells.
Try out all those new capabilities in the visualizing atmospheric measurements demo app.
Editing improvements
The editing experience is constantly evolving as we work to maximize end user productivity, data quality, and powerful editing capabilities in your applications. Here are some of the updates made in this release:
Use data from other layers: Calculate values for fields in feature form and editor widgets using data from other layers in your Arcade expressions. This means you can derive values based on another layer. For example, calculate fields in a point layer based on values from an intersecting feature in a polygon layer, including layers not part of the map.
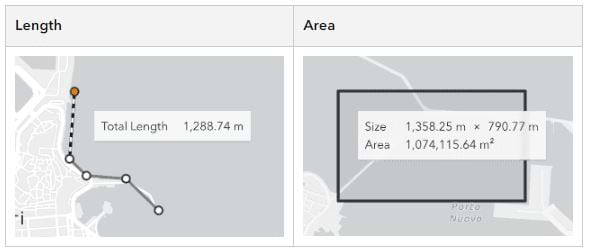
2D tooltips while drawing: Use tooltips to display total length of polylines and area of polygons while drawing new features and updating existing features. While already possible in 3D, this release adds support for 2D.
Delete features in the Feature Table widget: The Feature Table widget now supports deleting selected features.
Restrict editing capabilities: Support for app-level restrictions on attribute or geometry updates. This provides further refinement of editing capabilities that are defined in the service. The UI will automatically update based the editing capabilities allowed – whether they were defined in the service or via code.
Media layers: position, skew, and transform
If you are overlaying images or videos on the map, control points enable you to georeference specific locations of the media to position, skew and transform it on the map. In an upcoming release, there will be a widget enabling the end user to interactively adjust the media.
Check out the new MediaLayer with control points sample to see the ControlPointsGeoreference in use.
Working with multidimensional data
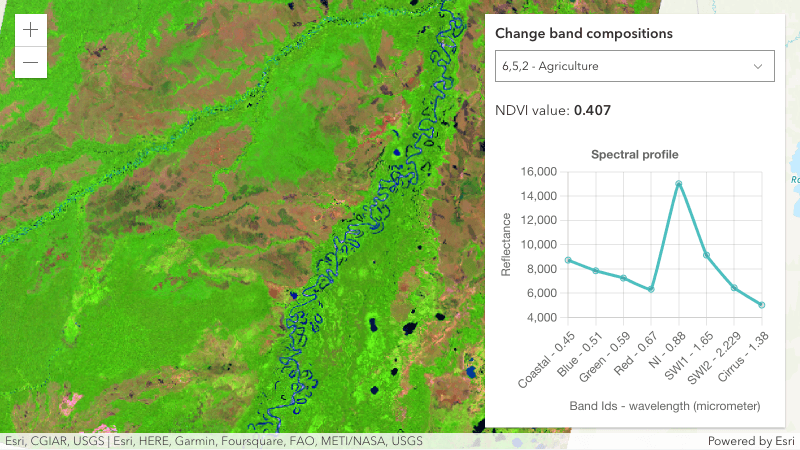
Multidimensional imagery data is commonly used in the scientific community to store atmospheric, oceanographic, and earth science data. The information is stored as slices, where the service has a slice for each unique combination of dimension values and variable names. You can visualize and perform analysis on this data on the client using the imagery layer and imagery tiled layer. We have enhanced these layers with the following capabilities:
Set display criteria: Expose only a subset of dimensional slices that meet your criteria. For example you may have a dataset containing soil temperature and moisture, and you can choose to expose only a subset of the data, like the soil temperature at a specific elevation range. Check out the Multidimensional ImageryTileLayer sample to learn more.
Work with transposed data: The identify() method was enhanced to return pixel values for all (or just the dimensional definitions that you specify) dimensional slices associated with a transposed multidimensional tiled image service. These services are created for optimizing performance while accessing pixel values across all multidimensional slices.
To learn more about working with multidimensional imagery, see the new documentation added to ImageryLayer and ImageryTileLayer.
Notable updates in ArcGIS Online for Developers
The November update of ArcGIS Online includes many improvements that are based on capabilities in the JavaScript API. Map Viewer and Scene Viewer provide a great way to explore your data and new styling options, and easily bring them into your app using the saved web map, web scene or layer. Here are a few example updates to check out:
- (Map Viewer) Binning: there is a new aggregation option to use binning. Bin size, fields, labels, and pop-ups can also be configured.
- (Map Viewer) Set the cluster symbol or renderer, including using the pie chart style.
- (Map Viewer) Settings for point and line animated symbols (published via ArcGIS Pro) have been enhanced to allow you to toggle animations on or off, change symbol size, reverse the animation direction, and control speed, looping, and duration

- (Scene Viewer) The new Dimensions tool let’s you interactively create dimensions with labels which display either the horizontal, vertical, or diagonal distance between the points. Using the tool you can group the dimensions into themes, with different colors and sizes for the lines and labels for each layer.
Accessibility
For increased accessibility, we made many improvements for better color contrasts in CSS themes, better use of ARIA roles and attributes, and various other changes. This makes both for a better experience with screen readers, but also for users in general. Accessibility is a requirement with high importance and will continue to incrementally improve across releases.
Changes to be aware of
We have made the following changes to the experience within widgets to improve the user experience:
- We updated the loading indicator in the Layer List, Basemap Layer List, and Table List widgets from a blue line to a less distracting blue circle that will display while the layer is loading.
- We integrated performance improvements in the search widget, which introduces in a change to the search results and suggestions. (This only applies when the searching against a layer-based source.) Learn more in the release notes.
We also removed non-esri packages from the CDN. This will only affect you if your code uses these packages directly and has no effect if you are simply using the API. Packages include: dgrid, dijit, dojo, dojox, dstore, and tslib. API versions 4.24 and earlier will continue to include the packages. The Dojo loader will continue to be included, to allow for AMD support in the browser.
Learn More
This blog explores many of the 4.25 updates, but there are even more in the release. For example, you can:
- Make a connection to a stream service web socket without having to add the stream layer to the map.
- Group unique values to a single symbol and categorize groups of symbols under headings.
- Access and control which features are currently selected in the feature table and subsequently highlighted within the map.
To get the full scoop, check out the release notes, and play around with the new samples.
Let’s talk about the release!
Learn about the new features added at version 4.25 of the ArcGIS API for JavaScript, directly from the product team! We are hosting a livestream on November 29th, 9:00am PST. This will be an informal setting for the JavaScript API product team to demo new features and answer questions from the audience. We hope to see you there!
What’s New with the ArcGIS API for JavaScript v4.25: https://links.esri.com/WhatsNewJSAPI425


Article Discussion: