Happy Earth Day, web developers! Our first release of 2021 brings a collection of key enhancements and new capabilities that you can start using in your apps right away. Version 4.19 brings feature to feature snapping for 2D and 3D, remarkable performance gains for point feature layers, shadow highlighting, increased flexibility when using API keys, and much more. In addition, ES modules have moved out of beta, so developers have an additional option for consuming the API in their production applications. Read on to learn about some of the highlights in this release…
ES modules – production release
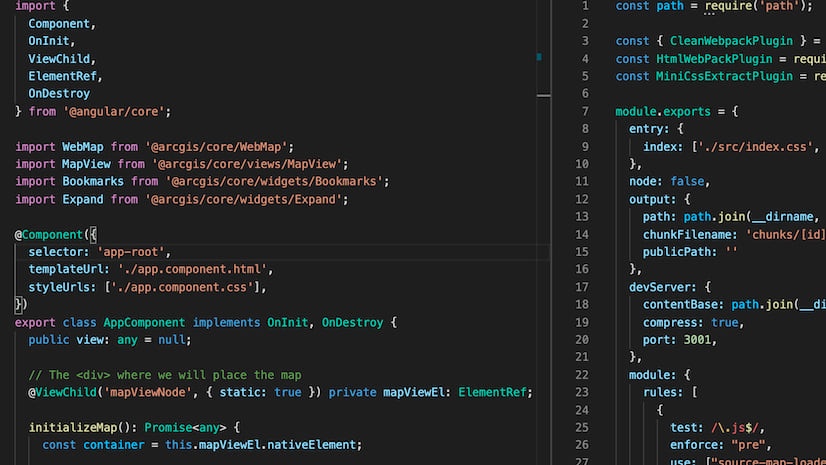
The API’s ES modules moved out of beta and are now ready for production use! The ES modules are a new option for consuming the API, which enables simplified code and seamless integration with modern frameworks and build tools. To get started, you’ll install the NPM package @arcgis/core and then you can use native imports like this:
import WebMap from ‘@arcgis/core/WebMap’;
import MapView from ‘@arcgis/core/views/MapView’;
Review the ES modules guide topic for the basic steps necessary for using ES modules. There are also sample apps available that demonstrate concepts for integrating the modules with various frameworks and tools.
With this release, installs for local builds are faster and easier. Rather than having to copy API assets like styles and localizations files into your project, assets are retrieved from a CDN at runtime by default (though it can be overridden).
Performance improvements
Significant performance improvements have been implemented in the API over the last year. These performance improvements allow us to render features faster, and with less memory consumption. This has allowed us to make further improvements for point FeatureLayers hosted on ArcGIS Online. In 4.19, FeatureLayer will try to optimize how it requests data and will fetch all its features at once from the server as opposed to requesting features on demand. Once loaded, the features won’t need to be re-requested from the server, which will make future redraws after panning and zooming much faster.
We will continue to broaden the scope of this performance optimization in upcoming releases to include ArcGIS Enterprise.
Snapping!!
We added support for feature-to-feature snapping in both 2D and 3D. You can snap to existing features from a FeatureLayer, GraphicsLayer, GeoJSONLayer, or CSVLayer currently loaded on the Map.
How do you access snapping?
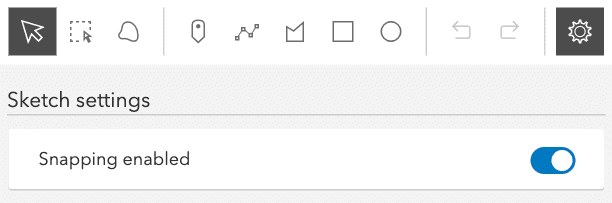
- Sketch widget: Use the new options menu to toggle snapping on/off or hold the Ctrl key while drawing a graphic. It is off by default.
- Editor widget: You can use snapping when creating or updating features. Currently, this is handled programmatically via the API by setting the snappingOptions property (and in an upcoming release it will be integrated into the Editor UI). We have updated the following samples to enable snapping: Edit features with the Editor widget, Editor widget with configurations, and Edit features in 3D with the Editor widget.
- The custom route, via SketchViewModel: If you want to build snapping into a custom workflow, you can enable snapping by using the snappingOptions object which contains various properties for configuring sketch snapping.
Snapping between features or within a feature
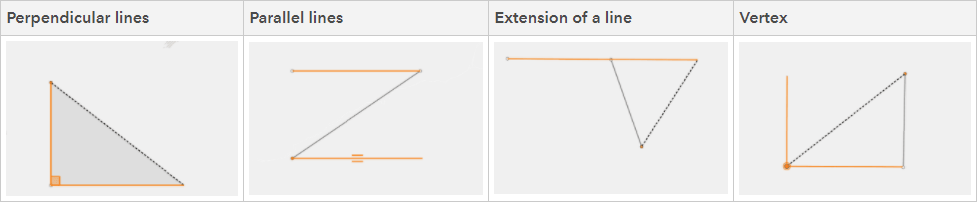
You might recall that in 4.18 we added self-snapping support for creating line and polygon features in 3D. In addition to feature to feature snapping that is described above, we also added self-snapping for lines & polygons in 2D maps. This capability makes it easier to create and update geometries that have parallel lines and right angles. You can snap to perpendicular lines (right angles), parallel lines, an extension of a line, and to a vertex of the feature being edited, as shown in the images below.
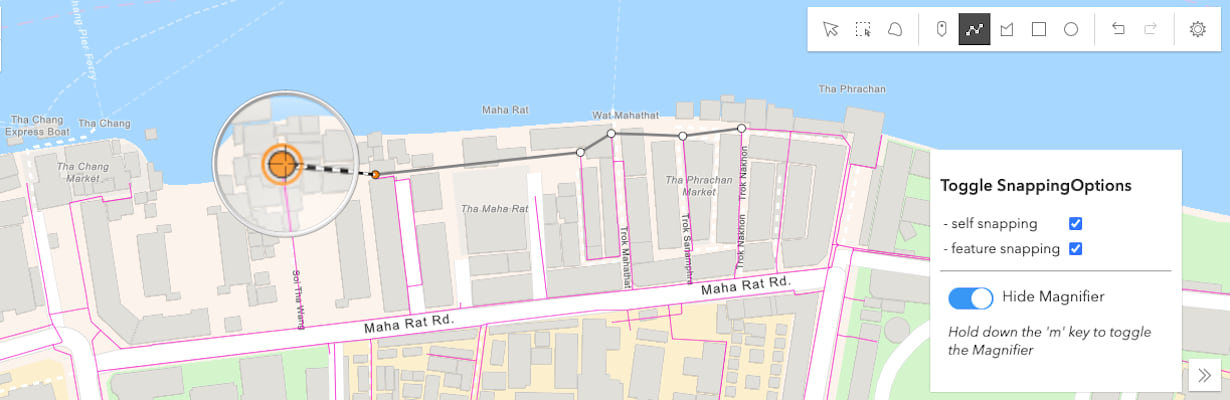
Want to magnify what you are snapping to?
Display a portion of the map or scene as a magnified image using the new Magnifier. The Magnifier can improve the editing and drawing experience of applications, especially when pairing with snapping (currently it must be enabled programmatically in your app, as illustrated by the below sample – we will be working to integrate it into the widget UI). The Magnifier can also be used completely independently, outside of editing scenarios.
API keys
In version 4.18, we added support for a global API key to use with Location Services. Version 4.19 adds more fine-grained control of API keys and adds more flexibility. For example:
- It is easier to use API keys in conjunction with ArcGIS Identity
- Search and Directions widgets will automatically default to the appropriate services when using a global API key.
- You can explicitly set an API key to use with Search and Directions widgets.
To see examples of how you can use API keys, see the Directions and Search widget samples.
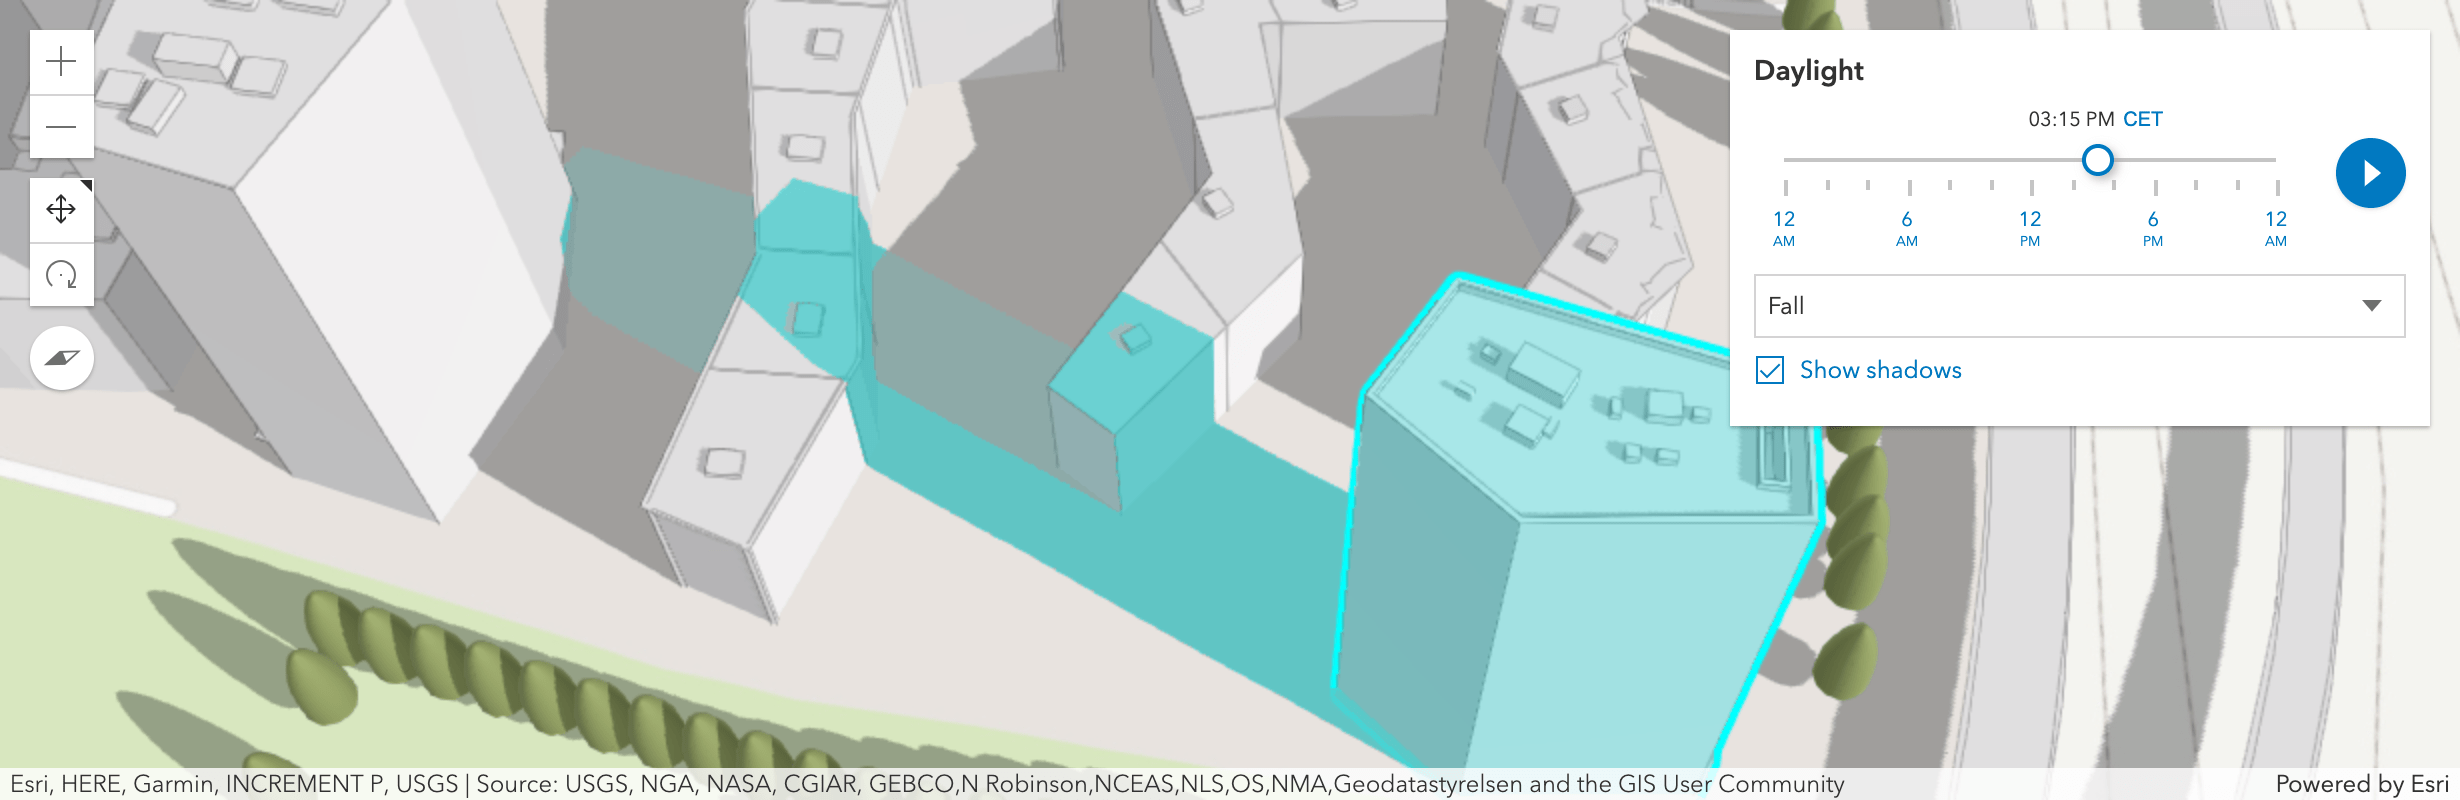
Shadow highlight (3D)
Identify the shadow of individual 3D objects such as buildings or trees, by clicking on the feature or calling highlight(). Combining the new shadow highlight with the Daylight widget you can determine how each building contributes to a certain shadowed area, for any day and time. You can also configure the color and opacity of the highlight to allow you to differentiate shadows that overlap with the highlighted one.
Line and polygon transformations (3D)
Interactively scale and rotate line and polygon geometries using the Sketch and Editor widgets. Clicking on a line or polygon being updated will toggle between reshaping and transforming the feature.
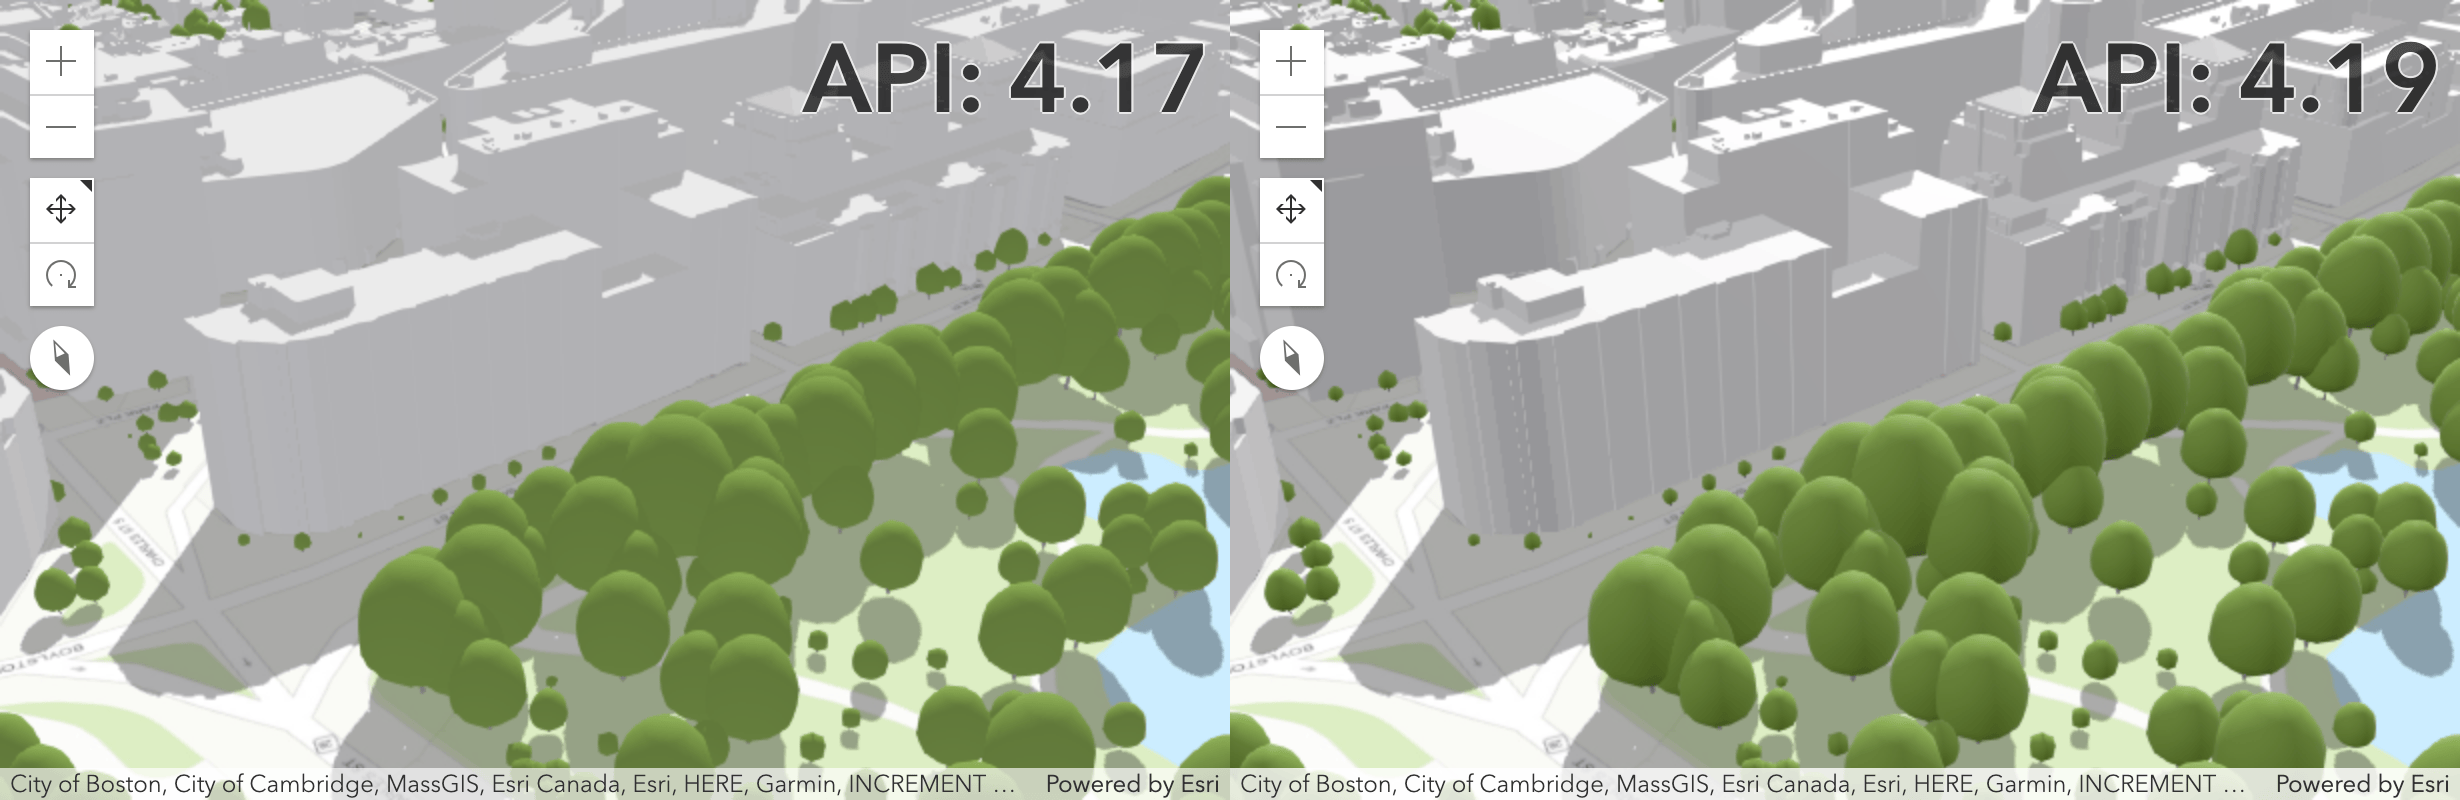
Improved rendering quality (3D)
A new lighting and shading model adds more contrast and definition to your 3D content. With the 4.19 release, existing scenes will benefit from this visual improvement when SceneView.qualityProfile is set to medium or high. Additionally, objects with Physically-Based Rendering (PBR) materials, such as used in WebStyleSymbols, display light reflections on glass or metallic surfaces.
Feature Table Filtering
The FeatureTable now allows you to filter the features displayed in the table based on geometry or extent. For example, you could filter the table to only show features that are within the current extent. By listening for the view’s extent updates, the FeatureTable’s filterGeometry is set to this new extent and only those features that fall within this area display.
OGCFeatureLayer spatial references
The OGCFeatureLayer now supports OGC API – Features – Part 2, which provides support for additional spatial references. Previously only WGS84 was supported. Now, all OGCFeatureLayers will work in WGS84 and WebMercator, along with any other spatial references provided by the service.
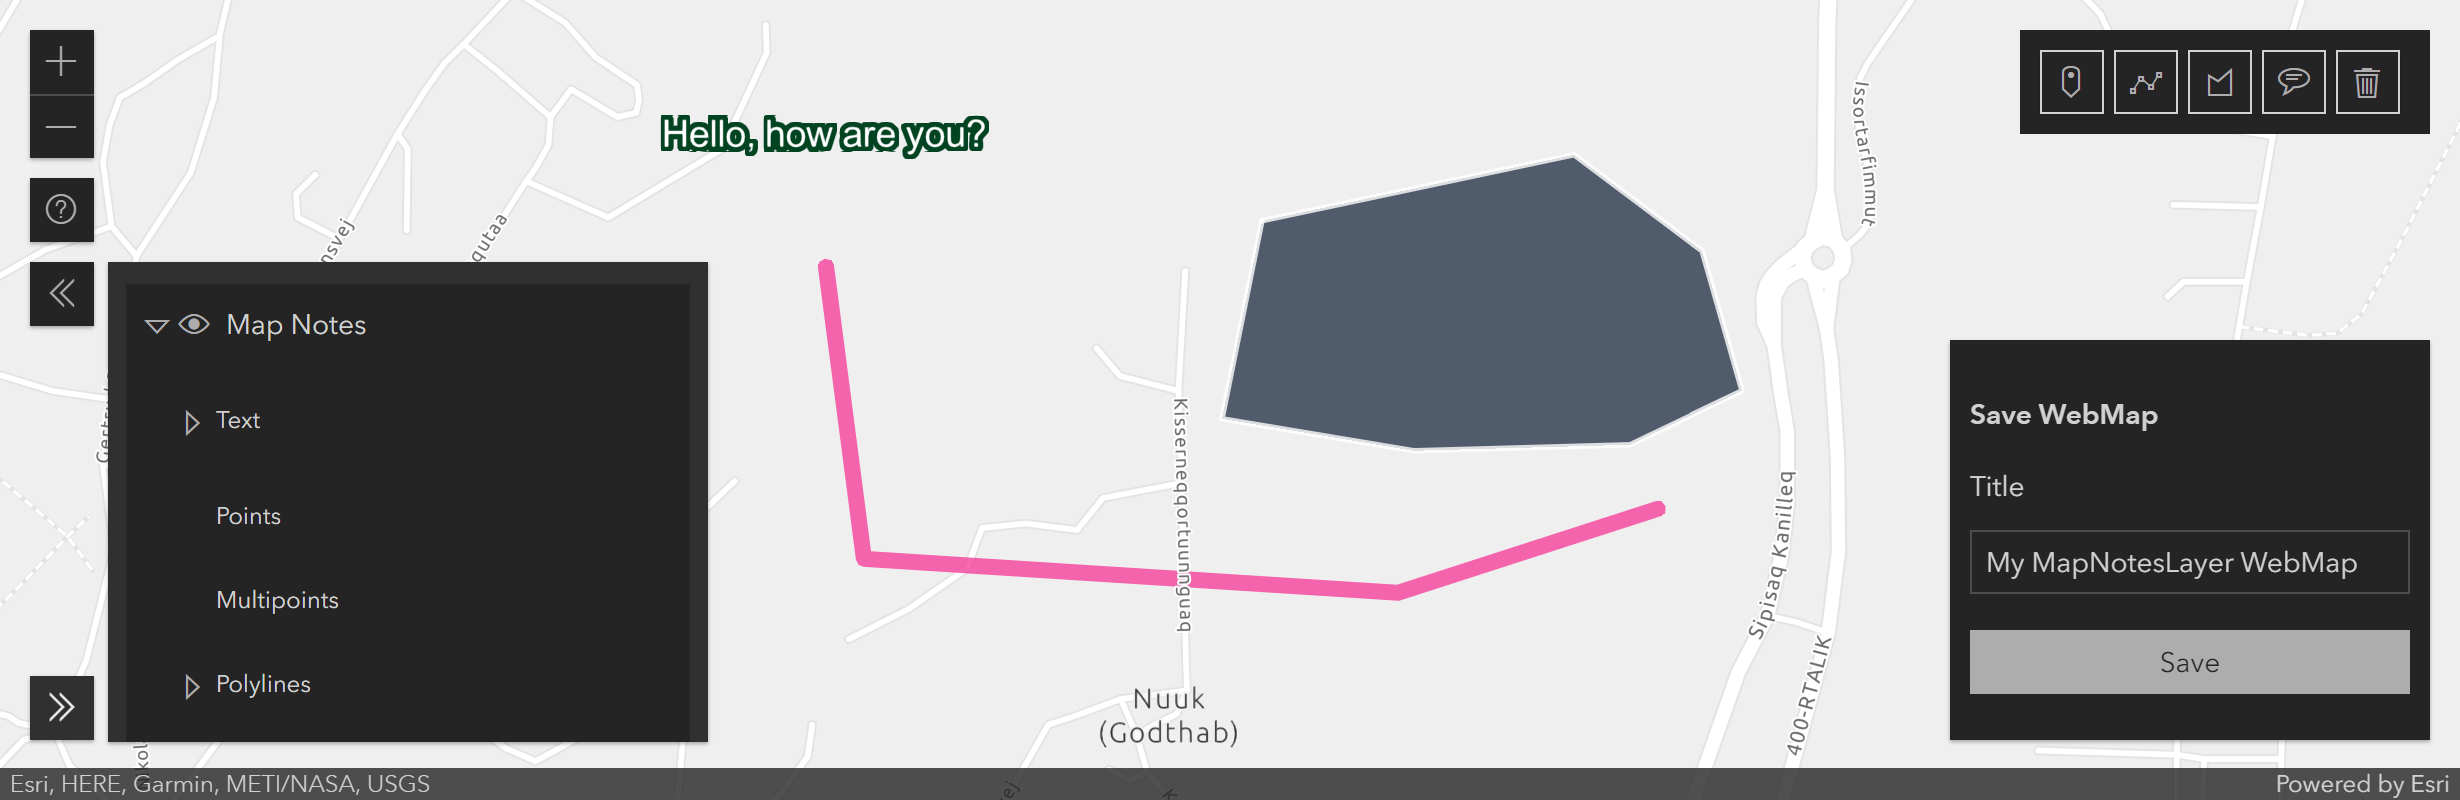
MapNotesLayer Editing
The MapNotesLayer can now can be added, updated, and deleted – allowing you to easily sketch, add, remove, or update notes from any map, then persist your changes using WebMap.save(). Editing is limited to Map notes that were created with the new Map Viewer; those created with Map Viewer Classic are limited to display-only. Check out the MapNotesLayer sample to see it in action.
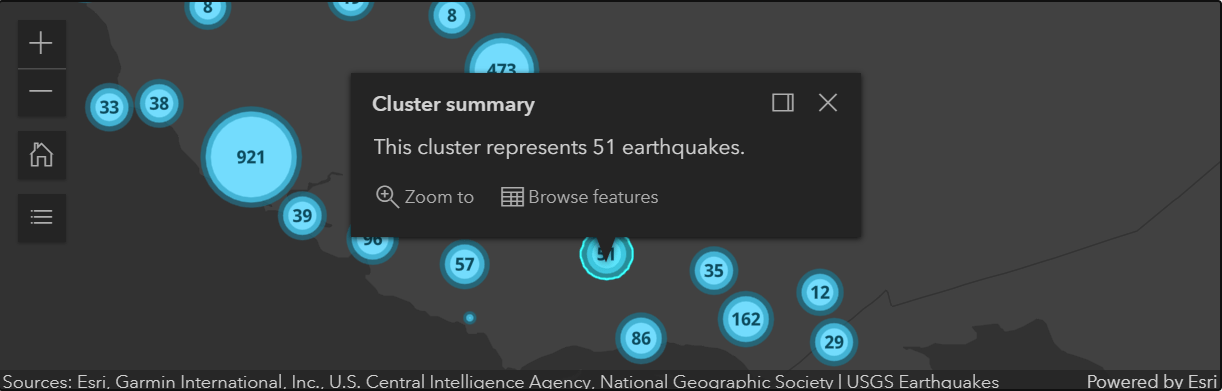
Browse cluster features in a popup
Using the cluster popup, browse and select individual features included in a cluster directly from the cluster popup. The “Zoom to” action was updated to zoom to the extent of a cluster’s features. You can explore these new actions in any of the cluster samples. Also, point clustering is no longer in beta.
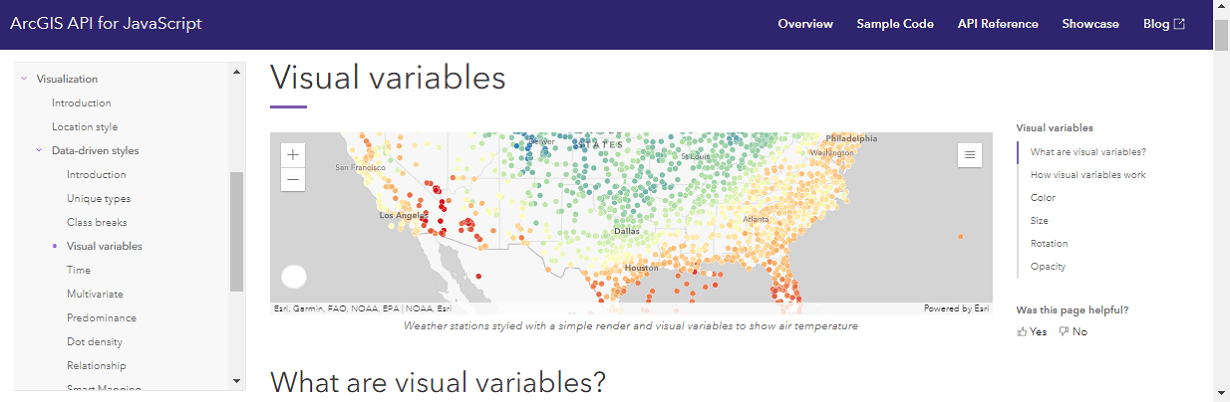
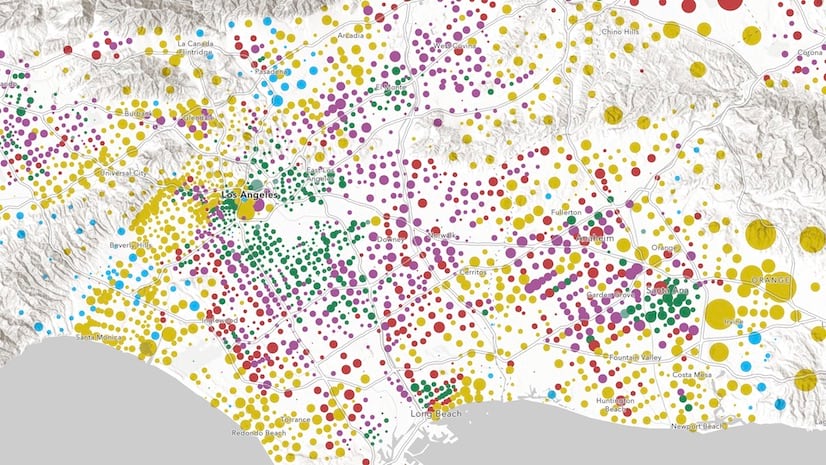
Learn all about data visualization
The data visualization guide was revamped with more than 20 new conceptual topics and four chapters. Explore the guide to learn about visualization best practices, the various layer styles available in the JS API, and browse the hundreds of symbols and color ramps provided for easy copy/paste use in your apps.
There’s a lot more to the release
To get the full scoop on what is included in the release, please review the release notes. You can also take it for a test drive by using the 4.19 new and updated samples.
Watch the 2021 DevSummit Plenary!
You can watch the entire 2021 DevSummit plenary on YouTube. This is a great way to get a well-rounded overview of Esri’s latest innovations around developer technology. Here are some topics you may be interested in:
Intro session with Jack
A platform for developers
Building apps
Feature tiles
Smart mapping
3D – from thematic to realistic
Web app design
Web developer tooling
New ArcGIS Map Viewer
Or, check out the full playlist.
On Earth Day
Every day is Earth Day …but this special dedicated day is a great opportunity to study some of the resources available for understanding the challenges our planet faces and finding ways that each of us can contribute in our own way. Here are some interesting sites that you can explore and share with others:
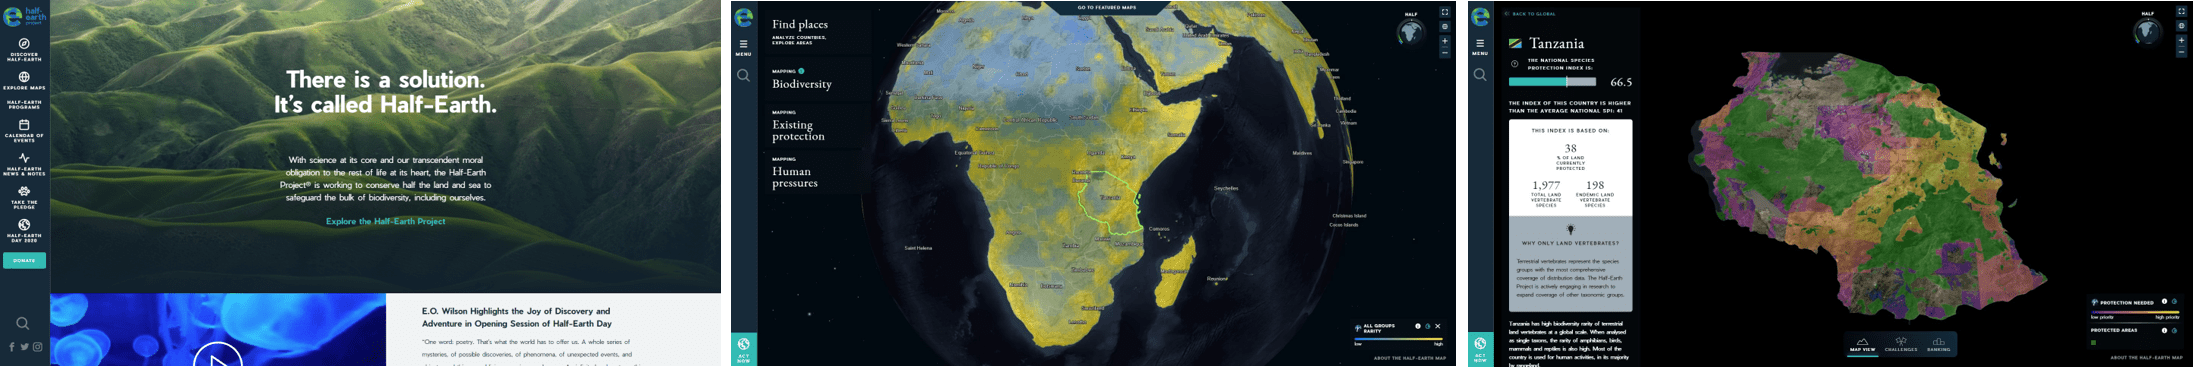
Half-Earth is a call to protect half the land and sea in order to manage sufficient habitat to reverse the species extinction crisis and ensure the long-term health of our planet. Built with the ArcGIS API for JavaScript, the Half-Earth Map provides decision-makers and communities with the information they need to make informed conservation management decisions that meet the needs of both biodiversity and people. It utilizes geospatial species distribution data and analytics to guide where we have the best opportunity to conserve the most species.
Earthday.org’s mission is to diversify, educate and activate the environmental movement worldwide. This site aims to share how you can take action in your own life to help end plastic pollution, fight climate change and protect our precious lands, air, water and wildlife. There is an interactive map for searching for Earth Day events.
Banner photo by sheri silver on Unsplash.

Article Discussion: