Version 4.24 of the ArcGIS API for JavaScript (JS API) introduced client-side binning as a new feature reduction method for visualizing the density of point layers.
What is binning?
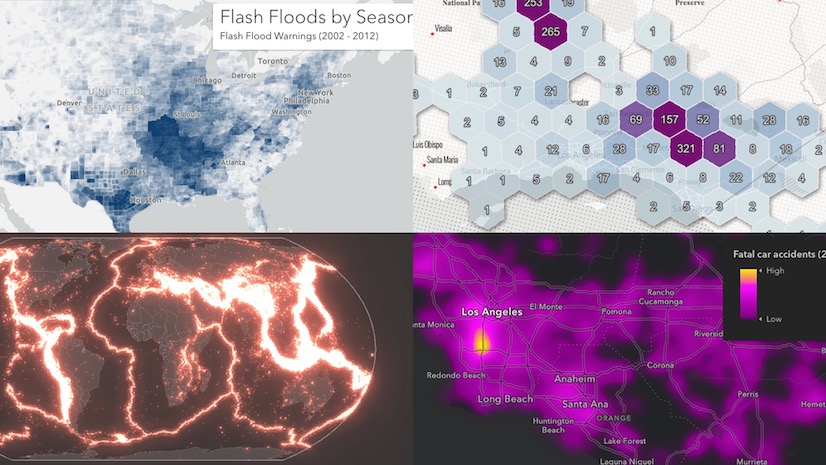
Binning aggregates data to predefined cells, effectively representing point data as a gridded polygon layer. Typically, bins are styled with a continuous color ramp and labeled with the count of points contained by the bin. The JS API uses the public domain geohash geocoding system to create the bins.


Enable binning on any point layer
Binning is configured by providing a FeatureReductionBinning instance to the featureReduction property of FeatureLayer, CSVLayer, GeoJSONLayer, WFSLayer, or OGCFeatureLayer. The FeatureReductionBinning instance can be autocast from a plain JavaScript object.
The following snippet shows how to enable binning and highlights a few key properties.
layer.featureReduction = {
  type: "binning",
  fixedBinLevel: 3,
  fields: [
    // add aggregate fields here
  ],
  renderer: {
    type: "simple"
    // other renderer properties
  },
  popupTemplate: {
    content: "This bin contains <b>{aggregateCount}</b> features.",
    // other popup template content
  },
  labelingInfo: [
    // add labels to bins here
  ]
};
Let’s explore each of these properties:
Fixed bin level
The fixedBinLevel property of FeatureReductionBinning defines which geohash level to use for the aggregation. The higher the number, the higher the resolution.
The following images show examples of the same data aggregated at bin levels 1-3.


Aggregate fields
Feature count is the most common way to summarize points within bins. For this reason, we provide the aggregateCount aggregate field out-of-the box in all binned layers. This field contains the total count of features contained by each bin.
In addition to aggregateCount, you may define other aggregate fields using the FeatureReductionBinning.fields property. This property defines which and how the layer’s numeric fields will be aggregated within each bin.
For example, the layer representing car crashes in the initial image contains several fields documenting the number and types of people involved in each crash incident (e.g. motorists, cyclists, pedestrians, etc.). Using the FeatureReductionBinning.fields property, you can define aggregate fields that sum the total number of injuries and fatalities within each bin.
layer.featureReduction = {
  type: "binning",

  fields: [{
    // The name of the aggregate field to reference in FeatureReductionBinning
    name: "SUM_PERSONS_INJURED",
    // This field exists on the underlying point layer
    onStatisticField: "NUMBER_OF_PERSONS_INJURED",
    statisticType: "sum"
  }, {
    name: "AVG_PERSONS_INJURED",
    onStatisticField: "NUMBER_OF_PERSONS_INJURED",
    statisticType: "avg"
  }, {
    name: "SUM_KILLED",
    onStatisticField: "NUMBER_OF_PERSONS_KILLED",
    statisticType: "sum"
  }]
};
Once defined, the fields may now be used in the renderer, popupTemplate, or labelingInfo of the FeatureReductionBinning object.
Renderer
The FeatureReductionBinning.renderer property defines how the bins will be styled. Any renderer supported for polygon layers can be used for binning visualizations. Unlike FeatureReductionCluster, FeatureReductionBinning does not have a default renderer. Therefore, this property must be defined by the developer.
Typically, the renderer uses the aggregateCount field in a color visual variable to visualize the density of features.
layer.featureReduction = {
  type: "binning",

  renderer: {
    type: "simple",
    symbol: {
      type: "simple-fill",
      color: [0, 255, 71, 1],
      outline: null,
      outline: {
        color: "rgba(153, 31, 23, 0.3)",
        width: 0.3,
      },
    },
    visualVariables: [
      {
        type: "color",
        field: "aggregateCount",
        legendOptions: {
          title: "Number of crashes"
        },
        stops: [
          { value: 0, color: "#d7e1ee" },
          { value: 25, color: "#cbd6e4" },
          { value: 75, color: "#b3bfd1" },
          { value: 200, color: "#c86558" },
          { value: 300, color: "#991f17" }
        ]
      }
    ]
  }
};

Renderer settings should target a specific fixed bin level. In the example above, the color variable has a range of 0-300. This works well since there are a few outliers with numbers above 300. For example, the bin with the highest number of crashes has an aggregate count of 482. If I adjust the fixedBinLevel to 7, the maximum aggregate count is 135. Keeping the same renderer configuration makes the bins looked washed out.

On the other hand, the highest aggregate count in level 5 is nearly 6,000. Without adjustments to the renderer defined at level 6, many of the bins will render with the darkest color.

Therefore, I suggest you determine the desired binning resolution before spending time on configuring the renderer.
Labels
Labels are defined on the labelingInfo property of FeatureReductionBinning exactly as they are defined on individual features of a layer. Only the aggregateCount field and other fields defined in FeatureReduction.fields may be used in the label expression.
layer.featureReduction = {
  type: "binning",

  labelingInfo: [
    new LabelClass({
      minScale: 144448,
      maxScale: 0,
      deconflictionStrategy: "none",
      symbol: {
        type: "text",
        color: "white",
        font: {
          family: "Noto Sans",
          size: 10
        },
        haloColor: "gray",
        haloSize: 0.5
      },
      labelExpressionInfo: {
        expression: "Text($feature.aggregateCount, '#,###')"
      }
    })
  ]

  // ... set other binning properties
};
You should take time to determine appropriate min and max scale levels for each label class, so the labels are clearly visible, but also don’t overwhelm the view.
Popup template
Each bin’s popup is defined in FeatureReductionBinning.popupTemplate using the same API as layer.popupTemplate. The following snippet demonstrates how to define a popup template using aggregate fields.
layer.featureReduction = {
  type: "binning",

  // defines fields that can be used
  // in renderer, popupTemplate, labelingInfo
  fields: [{
    name: "avg_temperature",
    onStatisticField: "temperature",
    statisticType: "avg"
  }],

  // aggregateCount is a default field
  popupTemplate: {
    content: [{
      type: "text",
      text: "This bin contains <b>{aggregateCount}</b> features."
    }, {
      type: "text",
      text: "The average temperature in this bin is <b>{avg_temperature}° F</b>."
    }],
    fieldInfos: [{
      fieldName: "aggregateCount",
      format: {
        digitSeparator: true,
        places: 0
      }
    }, {
      fieldName: "avg_temperature",
      format: {
        places: 1
      }
    }]
  }

  // ...other binning properties
};
Bringing it all together
The following app defines aggregate fields and uses them to visualize the binned crash dataset with a renderer, popup, and labels.
The renderer visualizes each bin with a SimpleMarkerSymbol in the bin’s centroid. The marker size indicates the total number of crashes within the bin. Dark colors are used in bins where the majority of crashes resulted in some kind of injury.
Click the image below to view the app and explore the code.

Binning and spatial references
You may have noticed bin sizes look uneven. This is because of a combination of two factors:
- Bins are created from geohashes. Geohashes represent a grid of cells equally divided across the earth using latitude/longitude coordinates. Because the length of one degree of longitude shrinks as you move away from the equator, bin sizes near the poles are significantly smaller than bin sizes near the equator.
- Various map projections distort bin shapes and sizes located far from a projection’s lines of tangency.
Because geohashes are created in equal latitude/longitude coordinate intervals, bins generally look best (the most even) when viewed in the WGS84 geographic coordinate system. The following images show how the same binning configuration looks when viewed in different spatial references.
Click here to explore the app used to create these images.
.")
. Area distortion in locations far from the Equator distort bins so they appear larger than they are in reality.")
. Area and shape distortion in the corners of the map distort bins so they appear larger than they are in reality.")
.")

Future enhancements under consideration
At JS API version 4.24, FeatureReductionBinning is in beta. The following are enhancements currently under consideration for future releases of the JS API.
- Dynamically updating bin level on zoom (i.e. similar to how clusters recalculate on zoom)
- Adding additional bin shapes (e.g. hexbins, squares, etc.)
- Querying bins
- Server-side binning (for datasets so large, individual features cannot be performantly loaded in the browser)
Because the initial release is in beta, we’re seeking your feedback on future binning enhancements. Also, feel free to submit other ideas to improve the experience for aggregating data in general. You can reach out to me individually, or post feedback in the Esri community forum.

This is a great start. I am looking forward to dynamic bin levels and server side binning for my large datasets.