The recent release of version 4.8 of the ArcGIS API for JavaScript added more ways to visualize your data and enhance your web apps with new capabilities. One of the most highly anticipated capabilities was labeling with WebGL-enabled layers. We are proud to announce that labeling is now supported for FeatureLayers and CSVLayers in 2D MapViews!
Adding Labels
Adding labels with this new capability is very similar to how we add labels to MapImageLayers or to FeatureLayers in SceneViews.
The labelingInfo property of FeatureLayers and CSVLayers is specified as an array of LabelClass objects. The LabelClass defines the display logic for the labels, such as: label expressions, label placement options, scale ranges, and symbol type. When working with 2D MapViews, more than one LabelClass can be added to each layer, and the LabelClass symbol property will always be TextSymbol. The TextSymbol class supports altering the graphics of the labels, such as: color, font, halo, and other properties. The Font class (which is a property of the TextSymbol) supports styling the font used by the TextSymbol by setting the font’s: family, decoration, size, style, and weight properties.
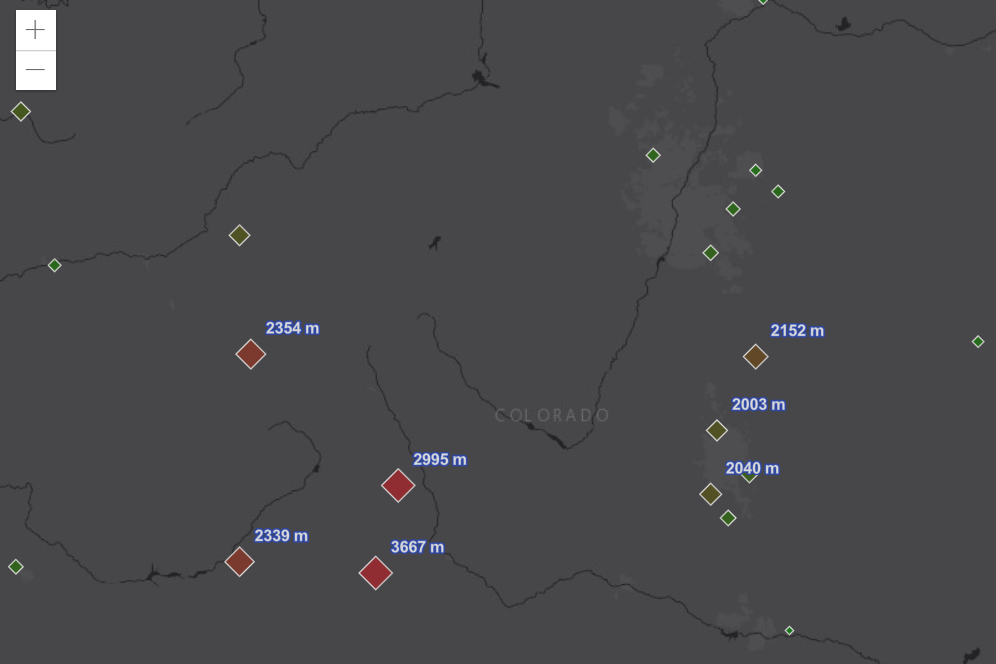
Here is a code snippet and a sample of setting the above properties, with labels selectively applied to features with elevations greater than 2000 meters.
var labelClass = {
  // Content
  labelExpressionInfo: {
    expression: "$feature.ELEVATION + ' m'"
  },

  // Appearance
  symbol: {
    type: "text",
    color: "white",
    haloColor: [30, 70, 190],
    haloSize: 1,
    font: {
      family: "arial",
      style: "normal",
      weight: "bold",
      size: 10
    }
  },

  // Placement
  labelPlacement: "above-right",

  // Visibility
  where: "ELEVATION > 2000"
};
Now we will walk through the different properties that we described above in further detail.
Label Expressions
The most important part of any typographic work is the actual text content. With the ArcGIS API for JavaScript, you do not have to set the text feature-by-feature; instead, you can define a generic rule that will be executed on each feature to derive the corresponding text.
labelClass.labelExpressionInfo = {
  expression: "$feature.NAME + ' (' + $feature.STATE + ')'"
};
These rules are expressions written using Arcade, a scripting language that is available across the entire ArcGIS platform.
When labeling a point layer you can use multiple label classes, so that every feature will be associated with more than one label. This is useful when there are several attributes that should be displayed.
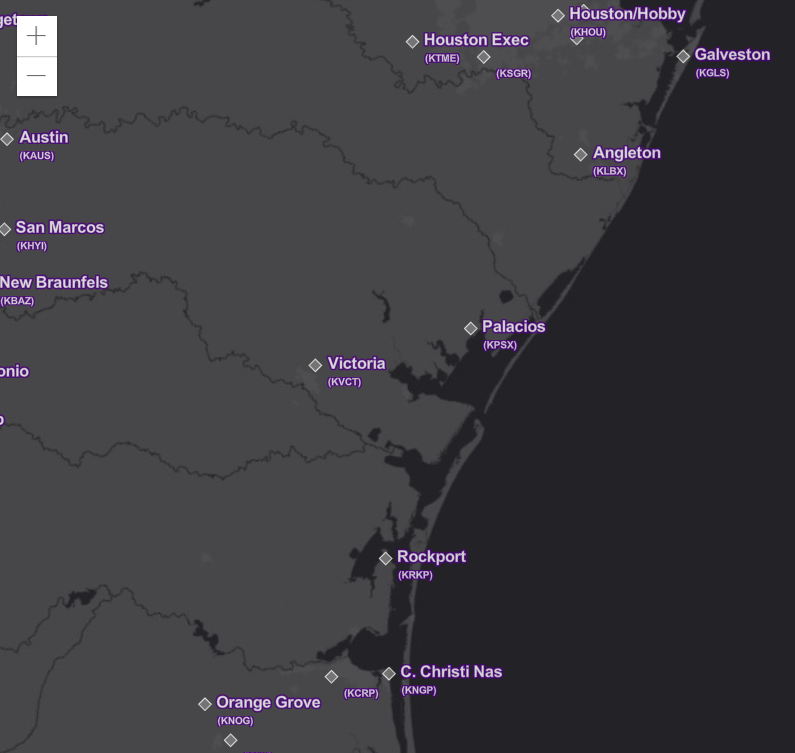
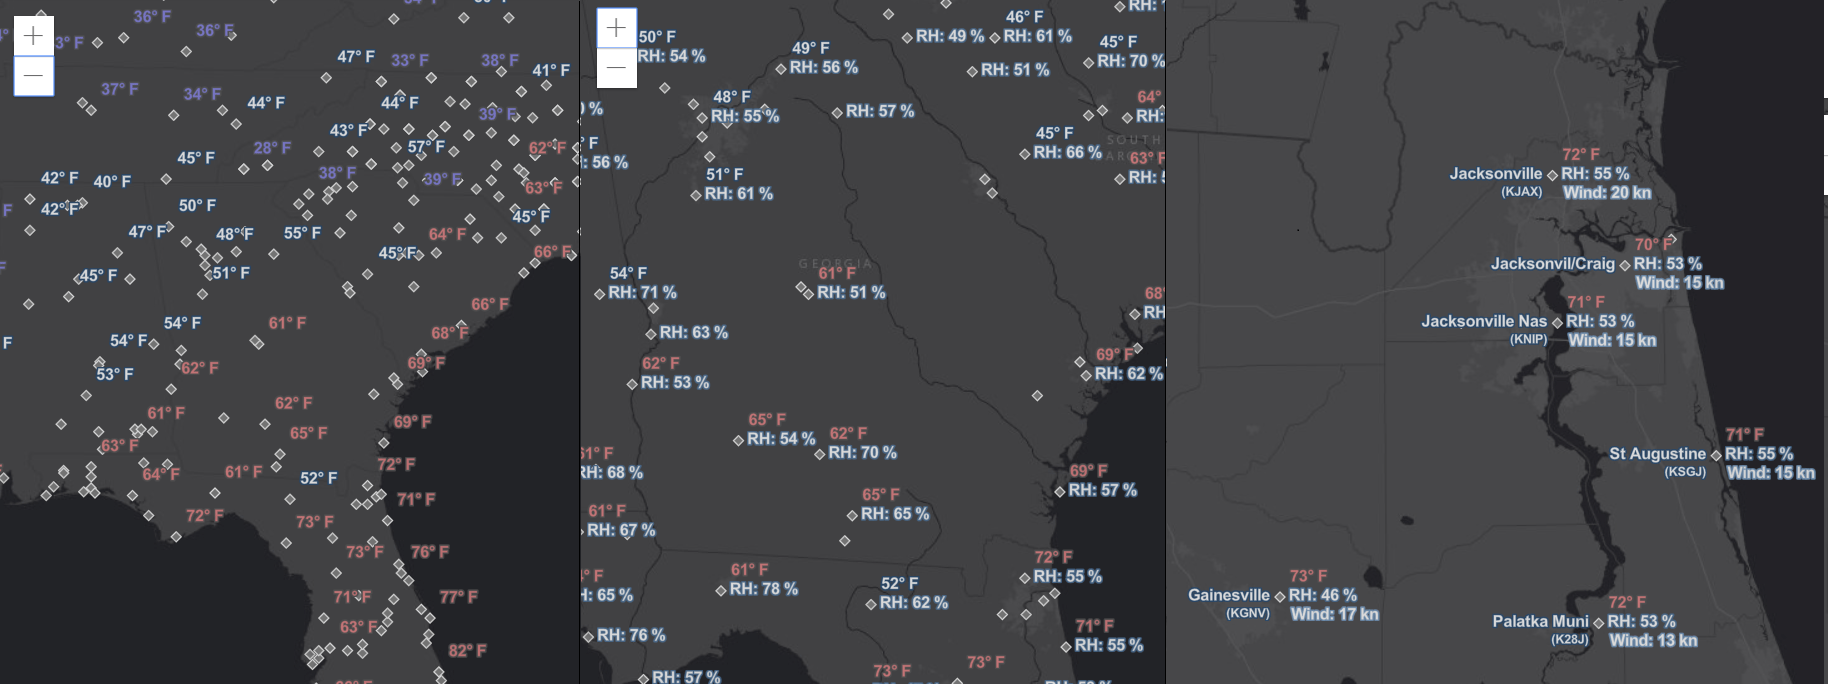
We prepared an app that displays two labels for each feature; notice how the name of a weather station appears to the right of the marker ("center-right" placement) while the 4-letters ICAO code is displayed just below ("below-right" placement).
Label Placement
The purpose of LabelClass is to emit a label; the term placement refers to its relative position to the feature. The documentation for LabelClass lists all possible values for the placement attribute but, in short:
- When labeling polygons, for the time being, there is nothing to customize: the label will be placed on the centroid.
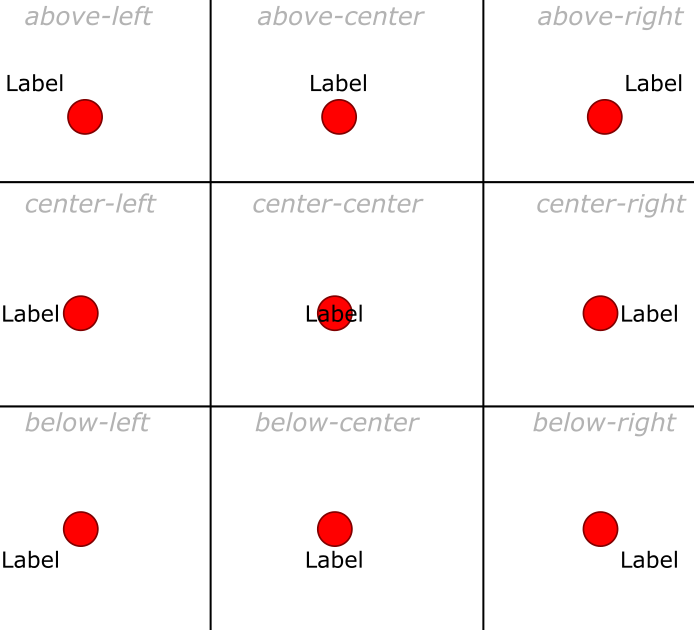
- When labeling points the placement is a string that specify the relative vertical and horizontal position of the label with respect to the feature.
Label Visibility
When many features are present on the screen it is advisable to define several label classes, suitable for different scales. A good guideline is to display less information at smaller scales and to display more at larger scales, inviting the user to zoom in to get more details. To do this you set the minScale and maxScale properties appropriately on the different label classes. See this app that displays more information as you zoom in.
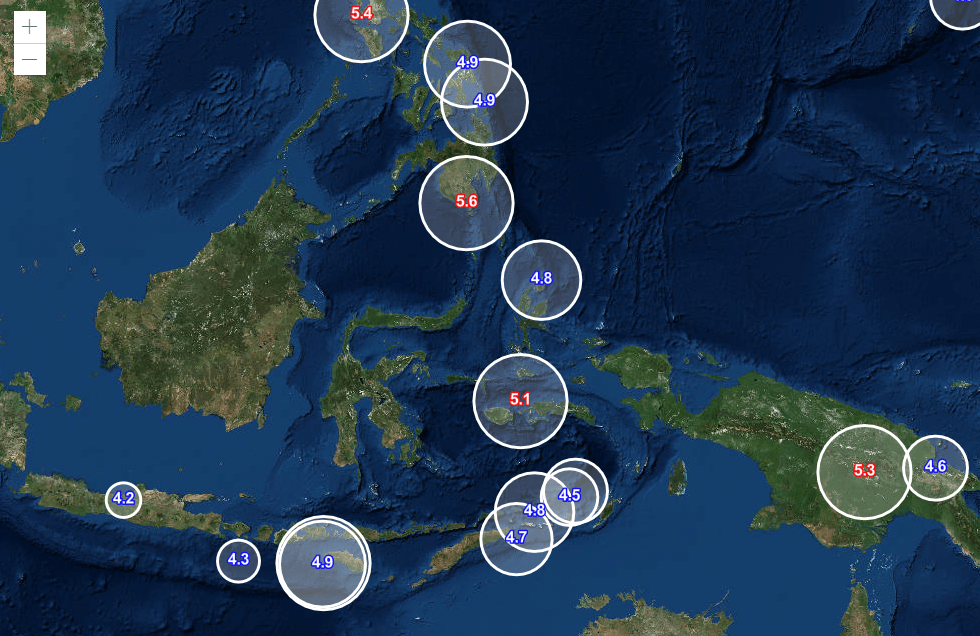
Another reason to modify label visibility would be based on the individual feature attributes. To do this you define multiple label classes and use the where property to apply each label class selectively to certain features. See this app that uses data from a CSV feed of earthquake events. Notice how earthquakes with a magnitude less than 5 are associated with a blue label, while the others are associated with a red label.
Text Symbols
The visual styling of labels is driven by the symbol property of the LabelClass. Symbols are used in the API to specify the visual appearance of cartographic items, and they are not specific to text and labeling. This is why, when a symbol is used to style labels, it must have its type property set to "text".
Text symbols are characterized by a few properties, some of them specific to their type.
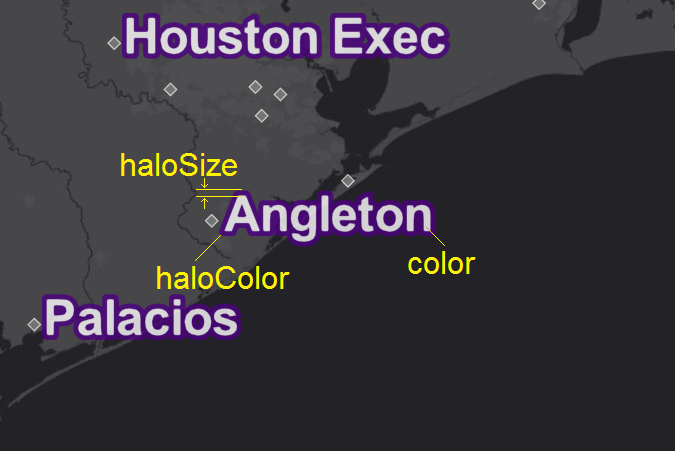
colordefines the inner color of the label.haloColordefines the color of the halo. The halo is a soft border around each glyph that can greatly enhance readability of the label, especially on top of certain visually-rich basemaps. Also, it looks cool.haloSizedefines the width in pixels of the halo.
Fonts
A symbol is also characterized by a font. This is a composite property that describes the typeface used for labels.
familyis the name of the typeface, e.g. “arial”.styledefines a variation of the original typeface; can be “normal” or “italic”.weightis the typographic weight; can be “normal” or “bold”.sizeis the size in points, e.g. 12.
Support for Font.family, Font.style, and Font.weight is dependent on hosted fonts files in .pbf format. By default, fonts are accessible on https://static.arcgis.com/fonts. The URL can be configured by setting the esriConfig.fontsUrl property. See fonts for available font families.
To get a feel for what these different font properties look like, check out our Font Explorer app, which lets you try out different fonts in a fun and safe space.
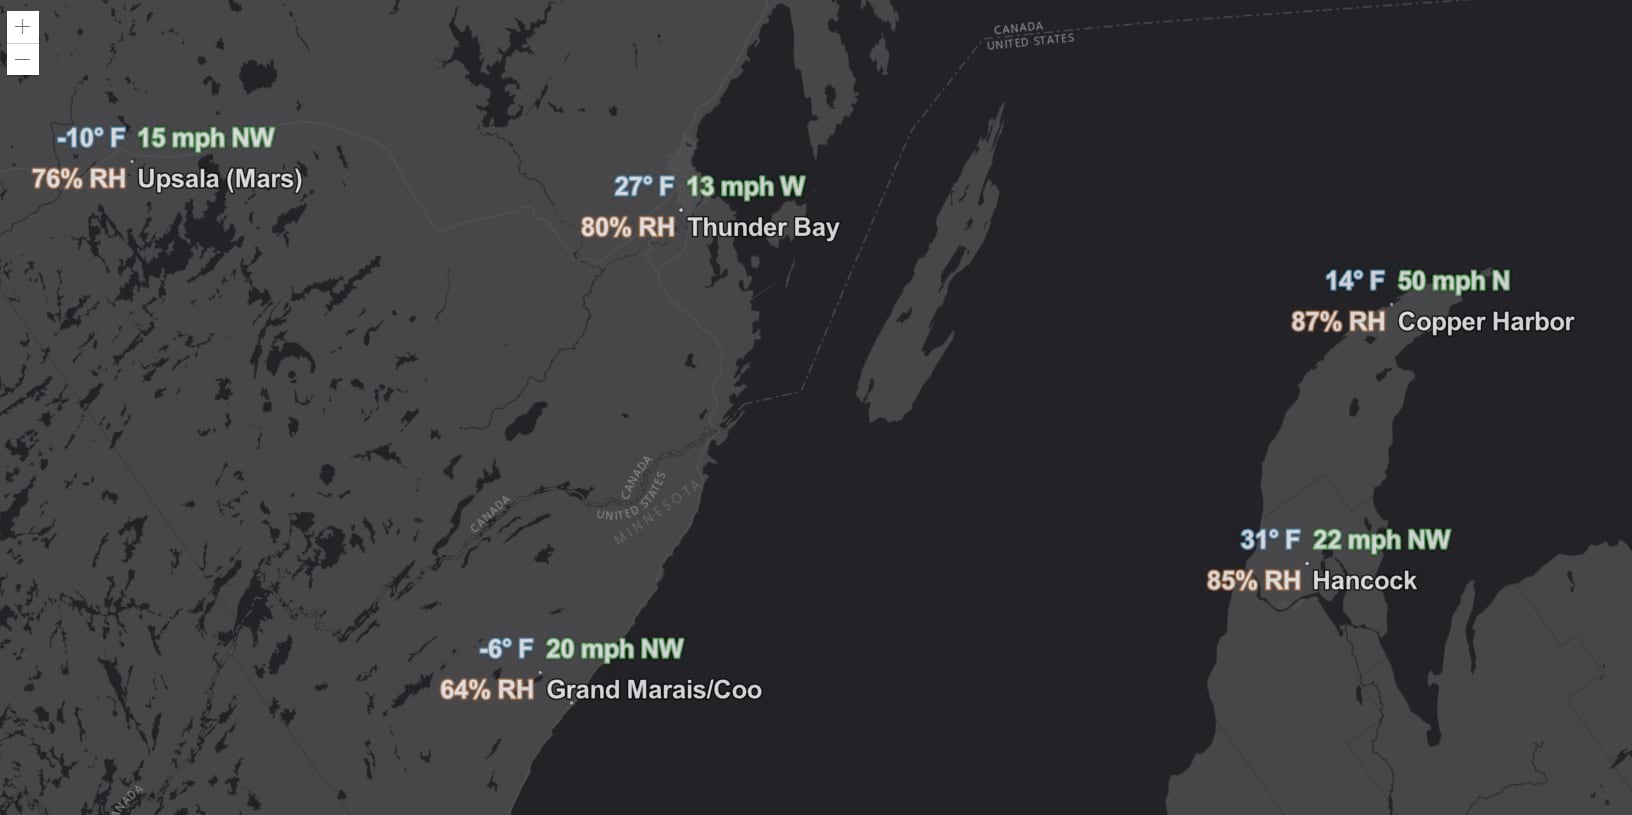
Now that we have explained all the new capabilities of labeling, let’s revisit the sample from the beginning of this blog. We employ some where logic in order to display temperatures at and above 32 degrees in red, and temperatures below 32 degrees in blue. The sample shows how to specify the content, appearance, placement and visibility of a label class.

Current Limitations
Please note that labeling is based on WebGL and is not supported in SVG-rendered FeatureLayers and CSVLayers, which is currently the default rendering mechanism in 2D MapViews. Labeling is available for 2D FeatureLayers and CSVLayers that are created from either feature services hosted on ArcGIS Online, or from non-hosted enterprise services from version 10.6.1 or later of ArcGIS Enterprise. For more information, please see the Labeling Guide page.
Learn More
Would you like to know more? For more information about labeling, check out these excellent resources:
Happy labeling!


Commenting is not enabled for this article.