Providing the ability to add a Legend widget to the LayerList to form a unified table of contents has been a common user request for the ArcGIS API for JavaScript (JS API). The 4.7 release (April 2018) of the JS API added support for LayerList panels, which allows you to accomplish this.
LayerList panels not only allow you to view a legend inside a toggle-able container that controls the visibility of the layer, but also provides a space for any custom content, including text, HTML elements, other widgets, and interactive charts from third parties.
-
LayerList panels allow you to add a Legend instance to the LayerList.
LayerList Overview
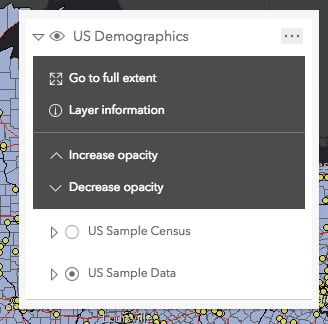
By default, the LayerList widget lists all operational layers in a web map and allows the user to toggle each layer’s visibility on and off.
// creates a LayerList referencing all operational layers
// and places it in the top right corner of the view
view.ui.add( new LayerList({ view: view }), "top-right" );
If you want to go beyond the default behavior, you can use the ListItem class to control most LayerList functionality.
The ListItem class manages custom content and actions for each layer referenced in the LayerList widget instance. Each list item includes references to core layer properties, such as its title, children (in the case of group layers), whether the layer is visible in the view, and whether the item is open (or expanded) in the widget. In addition to these options, you also have access to the layer and LayerView instances pertaining to the item, which opens the door for exposing powerful capabilities to the user via the LayerList.
List items are typically customized inside the listItemCreatedFunction property of the LayerList.
const layerList = new LayerList({
  view: view,
  // do something with the list items here
  listItemCreatedFunction: function(event){
    const item = event.item;
    // Opens the layer's item in
    // the LayerList programmatically
    item.open = true;
  }
});
Within the listItemCreatedFunction, you can add actions to each list item, which allow you to execute custom functions when the user clicks a corresponding icon. See the LayerList widget with actions sample and read the Enliven your web apps with custom actions blog to learn more about how actions work in the LayerList.
The panel property on the ListItem class provides you with the ability to add content pertaining to each layer inside the LayerList.
const layerList = new LayerList({
  view: view,
  listItemCreatedFunction: function(event){
    const item = event.item;
    item.panel = {
      content: [
        // add custom content here
      ]
    };
  }
});
Let’s take a look at various examples of adding custom content to a list item’s panel. Unless otherwise stated, all code snippets are assumed to be located within the LayerList’s listItemCreatedFunction.
- Add a Legend to the LayerList
- Add text to a list item
- Add multiple content elements in one panel
- Add interactive charts to a list item
Add a Legend to the LayerList
The Add a Legend to LayerList sample in the JS API documentation demonstrates how to create the classic table of contents look for the LayerList. You can create a Legend widget instance and add it to each list item, or you can simply use the convenience string “legend” and let the JS API do it for you.
const layerList = new LayerList({
  view: view,
  listItemCreatedFunction: function(event){
    const item = event.item;
    // displays the legend for each layer list item
    item.panel = {
      content: "legend"
    };
  }
});
Add text to a list item
If you enter any other text to the list item panel’s content, it will display directly below the Layer’s title.
const item = event.item;
// displays 'hello world' for each layer
item.panel = {
  content: "hello world"
};
A useful application of this is to display metadata related to the layer, such as the source of the data as defined in the ArcGIS Online portal item.
const item = event.item;

if(item.layer.loaded && item.layer.portalItem){
  // metadata retrieved from the layer's portalItem property
  const metadata = item.layer.portalItem;

  item.panel = {
    content: "<b>Source:</b> " + metadata.accessInformation
  }
}

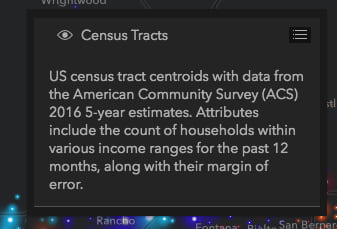
Or you can display the summary as written in the layer’s portal item.
const item = event.item;

if(item.layer.loaded && item.layer.portalItem){
  const metadata = item.layer.portalItem;

  // displays a summary of the portal item
  // describing the layer in the list item panel
  item.panel = {
    content: metadata.snippet
  };
}
Add multiple content elements in one panel
You’re not limited to one content item. The content property of the list item’s panel can be an array of multiple elements. That means you can display multiple metadata properties pertaining to the layer within the LayerList.
const item = event.item;

if(item.layer.loaded && item.layer.portalItem){
  const metadata = item.layer.portalItem;

  const imgElement = document.createElement("img");
  imgElement.src = metadata.thumbnailUrl;

  item.panel = {
    // image: metadata.thumbnailUrl,
    content: [

      // displays the item's thumbnail
      imgElement,

      // displays the date the layer was created
      "Created on " + metadata.created,

      // displays the number of times this layer was viewed
      "<p>Number of views: " + metadata.numViews + "</p>",

      // you can also subtract today's date from the last modified time stamp
      "<p>Last modified: " +  metadata.modified + "</p>",

      // displays a summary snippet describing the layer
      "<p>" + metadata.snippet + "</p>",

      // displays the source of the data used in the visualization
      "<p><b>Source:</b> " + metadata.accessInformation + "</p>"
    ]
  };
}
Check out the full app. Notice the app reads a web map item from ArcGIS Online. If you replace the existing web map ID with any other ID, then the app should work just the same as long as its layers are also hosted on ArcGIS Online.
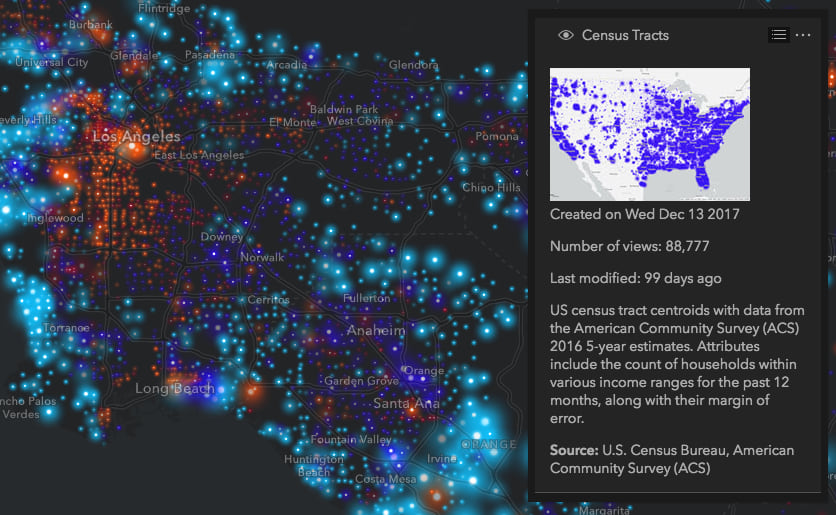
Notice that you can add HTML tags, including links and images. You can also generate your own information, such as calculating the number of days since the item was last modified.
The MapImageLayer – Explore data from a dynamic workspace sample in the JS API documentation also demonstrates how multiple content items can work together in providing an interactive user experience. The first item is an HTML div element containing two select elements, which allow the user to change the data visualization. The other is a legend instance, which describes how the data is classified.
item.panel = {
  content: [ divElement, "legend" ],
  open: true
};
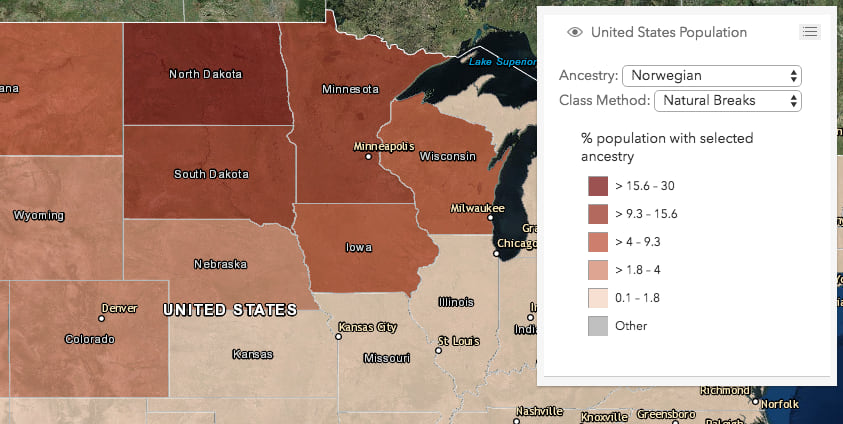
Placing both content items in the relevant list item’s panel makes the UI friendly for data exploration purposes.
Add interactive charts to a list item
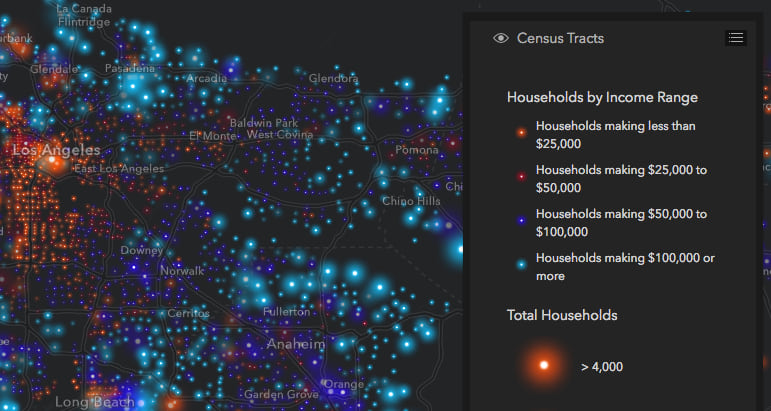
The Query statistics client-side sample demonstrates how to add a chart from a third party library to the LayerList. I won’t go into the details of how the statistics query is executed and how to create the chart, but all I had to do to render the chart in the LayerList was create a canvas element inside the list item’s panel. This element is reserved for rendering the chart.
const item = event.item;
// Create a canvas element in the Predominance layer list item panel
// This will be used to render the dynamic chart
if (item.title === predominanceLayer.title) {
item.panel = {
content: [
[
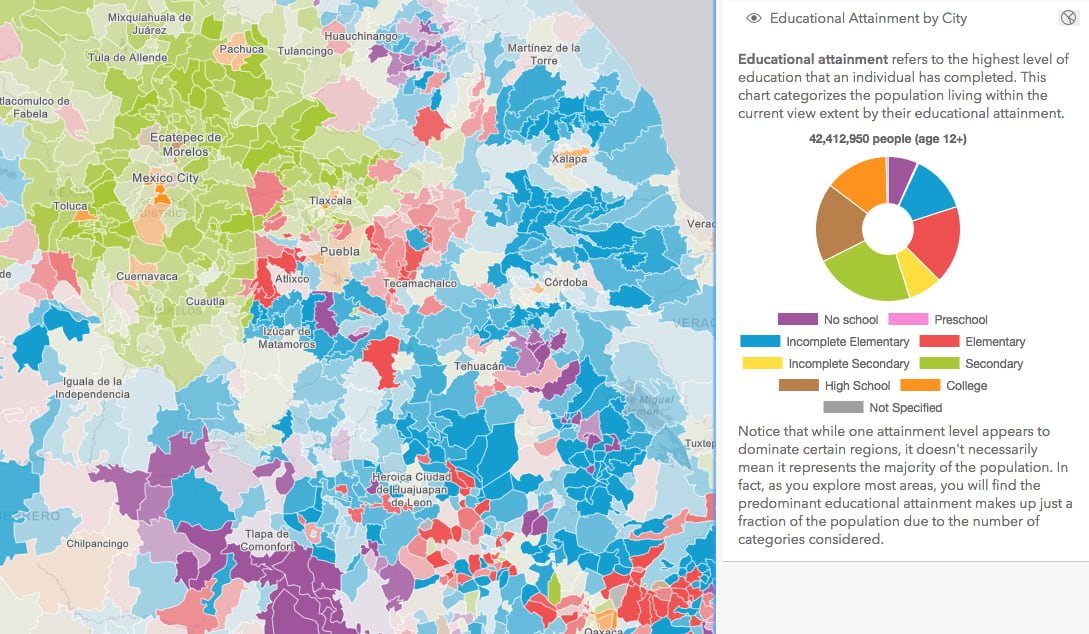
"<b>Educational attainment</b> refers to the highest level of education that an individual has completed. ",
"This chart categorizes the population living within the current ",
"view extent by their educational attainment."
].join(""),
// create canvas element for reference later
document.createElement("canvas"),
[
"Notice that while one attainment level appears to dominate certain regions, it doesn't ",
"necessarily mean it represents the majority of the population. In fact, as ",
"you explore most areas, you will find the predominant educational attainment makes up ",
"just a fraction of the population due to the number of categories considered."
].join("")
],
className: "esri-icon-pie-chart",
open: item.visible
};
}
The chart is wrapped with descriptive text explaining how to interpret the chart in relation to the map.
A reference to the canvas element can then be retrieved once the chart needs to be rendered. This is done by referencing the operationalItems property of the LayerList and finding the content element within a specified layer.
const canvasElement = layerList.operationalItems.find(function(item) {
  return predominanceLayer.title === item.title;
}).panel.content[1];
The chart updates dynamically as the user pans and zooms the view. Notice it is also interactive, displaying additional information as you hover the cursor over specific categories.
That’s all there is to it! Once the content renders in the list item’s panel, you can update it later in the app’s lifecycle and handle user interactions as you would otherwise outside the LayerList instance.
There’s a lot of ways you can take advantage of LayerList panels. So give it a try, build awesome apps, and share what you create!

Commenting is not enabled for this article.