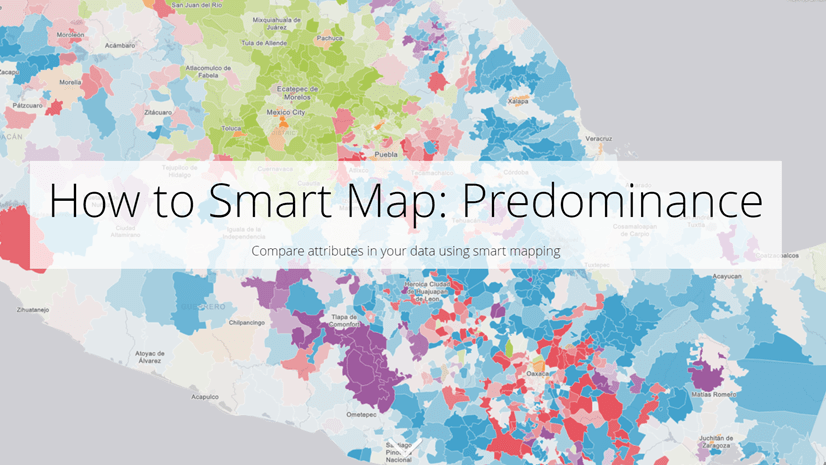
Smart mapping allows you to choose two attributes, and show them both within the same map. This is a valuable trick which can showcase your data in new ways, and also display relationships and patterns you might not have seen otherwise. This guide shows examples and steps for getting started with this mapping technique. To follow the detailed version of this guide interactively, visit this story map.
In some cases, using color to represent data values just makes sense. Other times, the size of a symbol creates a clear story for the smallest and largest values. Smart mapping allows you to choose two attributes from your data, and visualize the patterns from each attribute within a single map using both color and size (also referred to as bivariate mapping). This can be valuable for exploring your data, and allows you to tell a story using one map instead of two.
Why map with color and size?
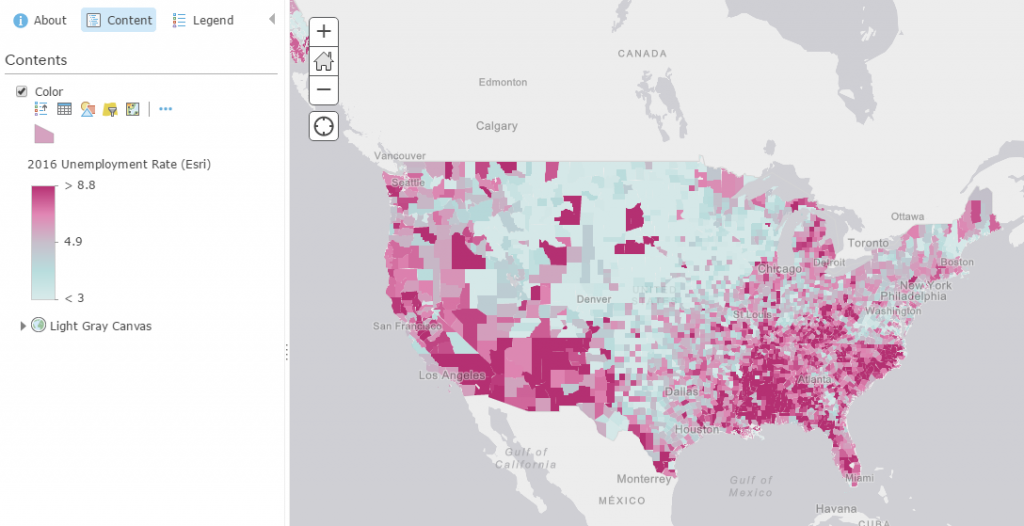
Imagine we have a map of unemployment rates in the US, which as represented by percentages. Using a color map is a useful way to represent these percentages in an understandable way.
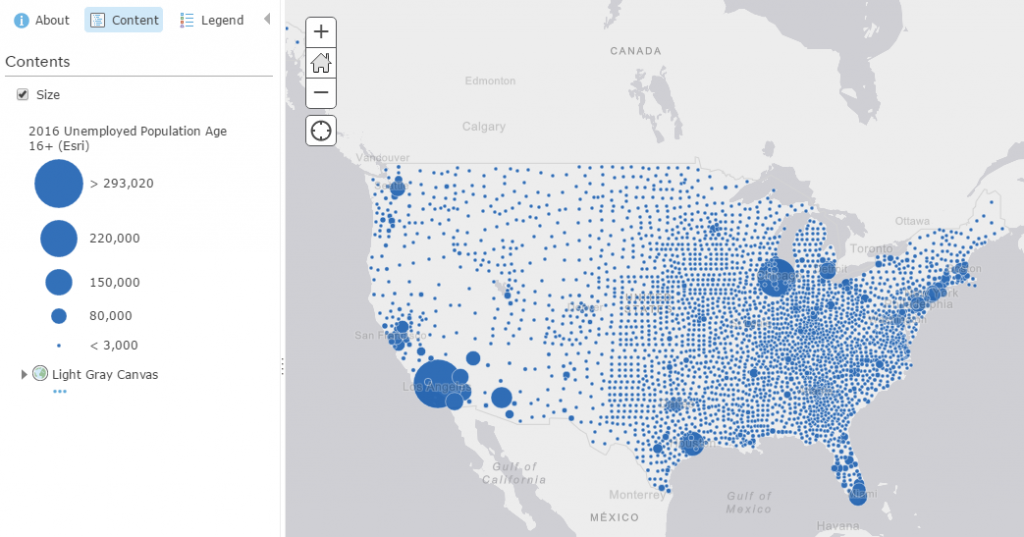
Now, imagine that instead we want to represent the amount of people who are unemployed. Using size is a great way to show quantities.
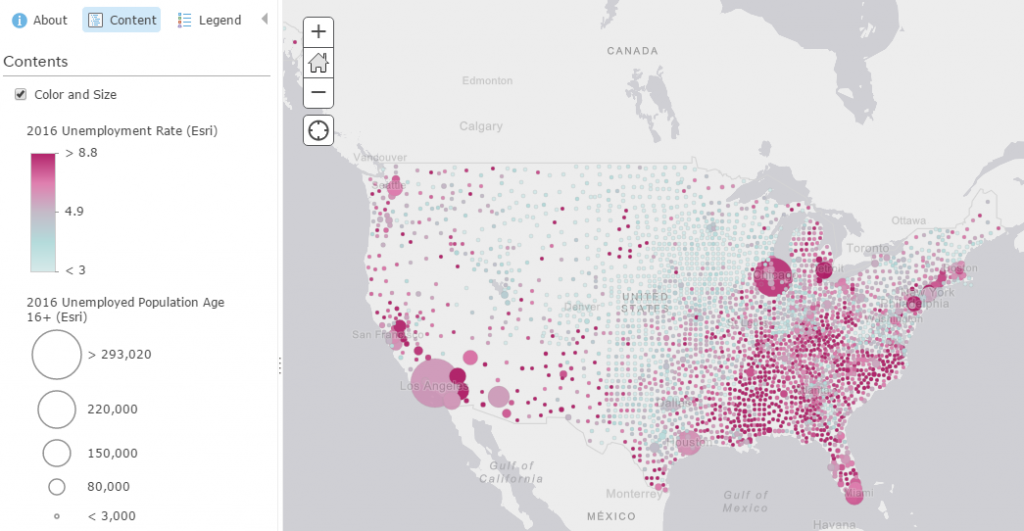
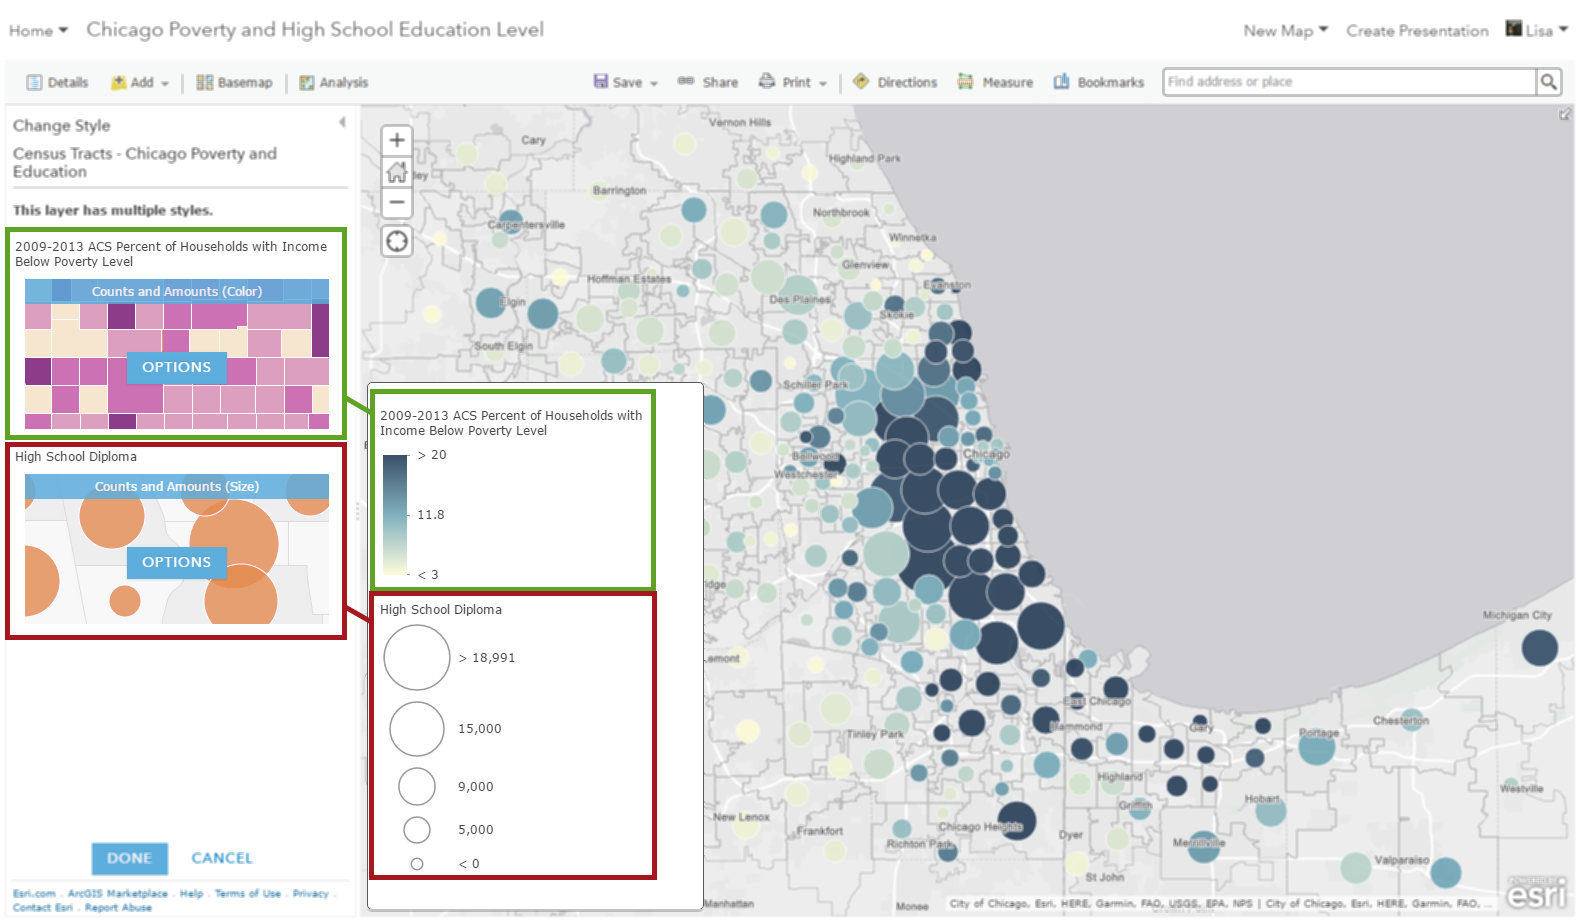
With smart mapping, you can select both of these attributes within the Change Style interface, and get a map where they are shown within the same map. This can highlight interesting relationships between attributes and represent patterns that tell interesting narratives. In this case, the map shows how high unemployment rates don’t necessarily follow the same pattern of high unemployed population. Stand-alone, these are important maps, but together, we can better understand what the numbers mean.
To make a color and size map, go to the Change Style for your layer within ArcGIS Online or ArcGIS Enterprise and select the two attributes you want to show in your map. The first attribute will be shown with color, and the second attribute will be shown with size.
Once you select the attributes you want to show, you have the opportunity to dive into the options for both the color and size settings for your map. This allows you to use your own knowledge of the data in order to make your map as clear as possible.
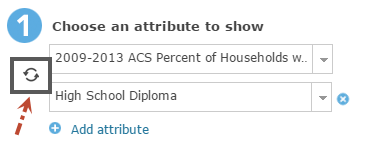
If at any point you want to try viewing the attributes where the color and size attributes are switched, simply swap them using the symbol to the left of the attributes.
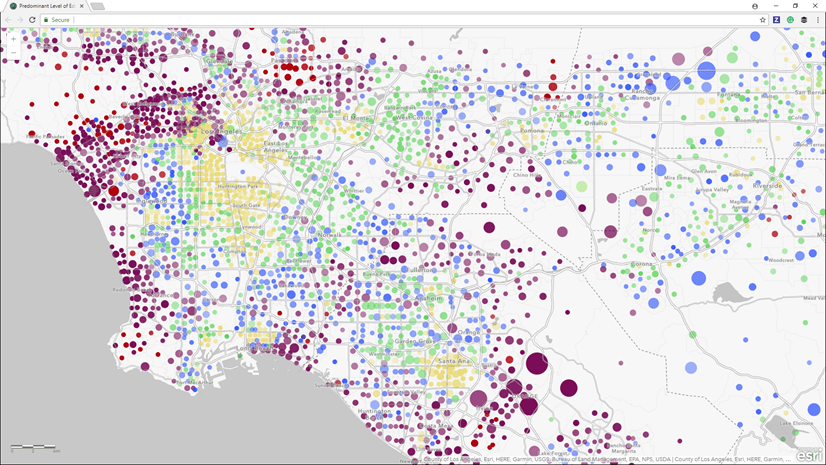
Mapping with both size and color opens the door to endless possibilities of maps. You’ll see patterns and relationships within your datasets that you may not have found otherwise.
It is easy to try on your own datasets! Explore patterns by choosing different combinations of your attributes.
For additional tips and inspiration, visit these smart mapping resources:
Thank you! We looked for this last week and couldn’t find it (because the blog wasn’t available yet). We were going nuts. Templates are due tomorrow for multiple services and this saved us.
So happy it helped!
Thanks for the article! This approach doesn’t look to work with conditional expressions from what I can tell. Even just making a duplicate form with cond. expressions will break the form from what I can tell.
Hi Randall – thank you for the comment and apologies for the delay in response! I just tested this and was able to successfully copy over a form containing conditional visibility to another layer in a different map using AGO assistant. A few things could have happened that caused your form to break, most likely revolving around ensuring the entire object is copied over. Make sure that the entire formInfo object is copied over including the expressionInfos property. If you don’t include this property, the expressions will not carry over. If you’re replacing an existing formInfo object, be sure you… Read more »
I need to create and manage Field Maps for many projects in dozens of parks. We’re likely to reach the limit of 16 offline areas per map fairly quickly, so duplicating maps should be a big help. This article mentions making “slight adjustments” to the copy of the map. Do you mean to imply that some types of changes would cause problems with the original map or forms? Is it okay to add or remove layers, and if so, does this apply to both operational and reference layers? Change a form or create a form for an additional layer? Filters?… Read more »
Hi Jill – thank you for your comment. I’m glad to hear this is helpful for your park workflow! I used the phrase “slight adjustments” for the context of the scenario in this blog post – it was not meant to imply that changes made to the map copy will cause problems to the original map. You can add and remove operational and reference layers, edit the form for additional and existing layers, and edit other properties of the map copy without changing the original map. If you make changes at the layer level, such as enabling sync, allowing editing,… Read more »
Is the technique of copying forms available in the Map Viewer as well as Field Maps? I’ve attempted copying the forminfo in the AGO Assistant without luck and I’m wondering if it’s just not an option for my application (or if I need to do more troubleshooting).
I was able to use the AGO Assistant approach, great instructions. For the python instructions, it would be helpful to include directions for folks that use SAML authentication.
When I look in AGO Assistant there is not a formInfo JSON object in my layer. Is it because I saved my form to the layer and not to the map? If so is there another way for me to create the formInfo JSON object?
I’m in the same boat as Jim as we will need to make several maps for several project and I would like to reuse the form on a new layer without having to re-create it every time.
I used AGO Assistant and copied everything over. I’m looking at the syntax and everything seems to be there but it’s not working. I even copied the entire JSON and it did not work either. Thankfully, I kept all of my forms open in a separate browser. So that I can painstakingly copy everything over one by one. There must be a better way. ugh