Let’s say you’re a farmer or farm real estate broker, and you are evaluating whether or not to buy a piece of land. Your business and your livelihood depends completely on the land and its capability to produce income.
How do you tell the difference between a bad piece of land and a piece of land that has good potential but hasn’t been managed well or has otherwise been neglected? What can the piece of land do, and what is it really worth?
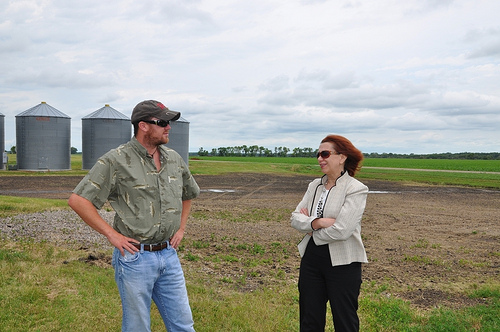
In a time of great uncertainty and volatility in financial markets and real estate valuation, the inherent capability of a piece of land’s soil asset has just become a lot easier to estimate. Image credit: USDA
To help answer these questions, esri has produced two new maps and map layers on arcgis.com. Both are planning-level maps of the economic capability of the United States’ soils. One map shows the economic capability when the soil is irrigated and the other when the soil is not irrigated. These maps are entitled Irrigated Land Capability Class and Non-Irrigated Land Capability Class, respectively.
Both maps are made directly from the SSURGO planning level soil dataset from NRCS. For the more technical among us, we used the MUAGGATT table fields ICCDCD and NICCDCD from SSURGO. Both maps cover the entire USA including Hawaii, Alaska, and Puerto Rico.
At 1:24,000 scale, each part of the United States falls into one of eight broad land capability classes.
The first four classes (1-4) are useful for growing crops, where each class from one to four needs more management or treatment, and has more limitations than the previous class. For example, classes 3 and 4 require more management or treatment than classes 1 and 2.
The last four land capability classes (5-8) are not useful for crops. NRCS recommends these lands be used for things other than crops, like rangeland, forestland, or wildlife habitat. Class eight isn’t even good for forestry, pasture or rangeland, and so instead NRCS recommends those lands be used for recreation, wildlife habitat, watershed, or aesthetic purposes.
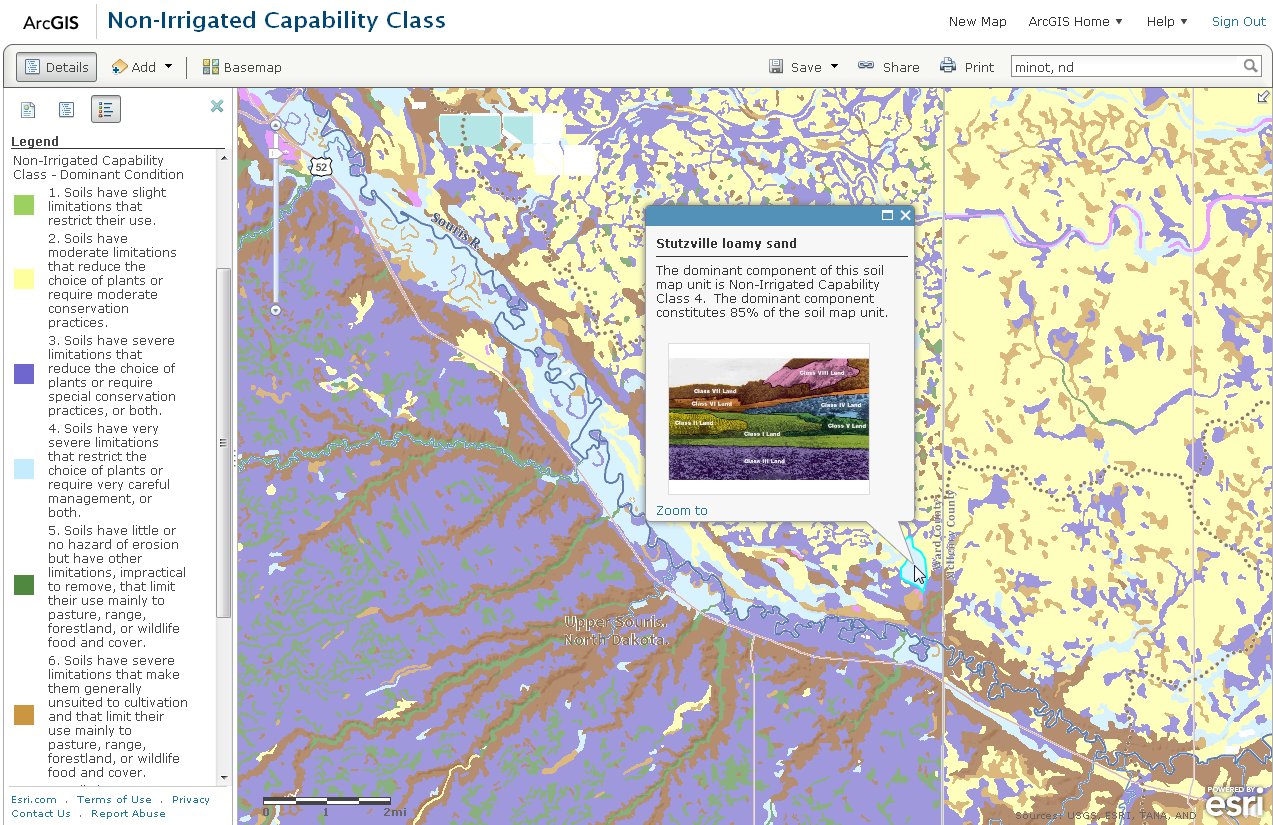
These maps feature a color scheme (shown here in 50% transparency) that matches an image of a sample landscape that you see when you click on each soil map unit. This graphic may then be used like a second legend, displaying the eight classes for you on a replica landscape.
Land Capability Class is one of the most important concepts in the US soil dataset SSURGO. Land Capability Class is even used in some states for property tax assessment. In the State of Ohio, for example, the tax code prescribes specifically how to use this map to determine property tax.
Esri plans to release more land capability maps, specifically Land Capability Subclass. We will let you know as soon as these maps are complete and online, and rest assured that the subclasses will be in a format that is easily mashed up with either the Irrigated or Non-Irrigated Capability Class maps.
Special thanks to Michael Dangermond for providing this post. Questions for Michael: mdangermond@esri.com

Article Discussion: