There are many ways to share a report within Power BI. As a report designer, you can add it to a workspace, embed it in an internal website (like SharePoint as an example), or share it publicly as a published report. These sharing methods have different purposes as well as pros and cons to using one over the other. As a report designer, you can use one or all three sharing methods to collaborate and distribute your reports and dashboards.
You may already be using the ArcGIS for Power BI component in your report or wondering if it is possible to share a report with the component added. Yes, you can share your report in any of the three methods with our component on the report page.

For each sharing method, this blog will outline the prerequisites, why you would use the specific method of sharing, any environments that are unsupported, and limitations. Finally, this blog will talk about some best practices when sharing a Power BI report that uses the ArcGIS for Power BI component.
Sharing a report to a workspace
To share a report in a workspace, you must have the following:
1. In Power BI, you must have a Power BI Pro license to share content to a workspace within Power BI Online.
2. You can use ArcGIS for Power BI at any Standard, ArcGIS Online, or ArcGIS Enterprise user level.
Benefits of using workspaces with ArcGIS for Power BI
A workspace allows you to move your report freely through all the workspaces you own or are a part of. You can add the report to dashboards or keep it within your workspace and share it with your team members. It also allows for collaboration on the report that you are creating.
Further, workspaces allow you to organize and manage Power BI content. You can group related reports, dashboards, and tiles together and share them with other people within your workspace or group’s workspaces. You can also manage access to content and control who can view and edit it.

When using ArcGIS for Power BI, you aren’t limited to what can be viewed, added, or shared in the report. Essentially, you have the full suite of resources at your disposal when sharing the report to a workspace.
Considerations when using a workspace with ArcGIS for Power BI
When using Power BI Online, reports can only be viewed within your workspace or workspaces that you have permission to access.
When using ArcGIS for Power BI, displayed features on the map depend on the user account level. On Power BI mobile, dashboards or workspaces can only be viewed by users with a standard account.
When sharing a report to a workspace that contains the ArcGIS for Power BI component, you can use all the available tools to design the map. However, there are universal limits to the number of features you can add to the map. This is dependent on two variables: the user account level being used and the type of feature that is added to the map.
For example, if you do not sign into an ArcGIS account when creating the map, you are automatically signed in as a standard user. That means you have access to some basemaps, demographic layers, infographic cards, and you will have a much smaller limit on the number of features you can display on the map. You also do not have any access to your organizational content; you can only access publicly available ArcGIS layers.
The user account level page details some of these limits and exact numbers when creating the map.
If you create a map using an ArcGIS account and intend on sharing this report in a mobile environment, all the data must be made public because any secure content cannot be accessed in a mobile environment. If you do share a map that contains secure content and view it on a mobile device, you will see the following blocking page:

Considerations when using workspaces
While a Power BI workspace is the easiest method for sharing a report, there are some scenarios where this might not work. For example, if you want to display this report on a public or internal website, you will not be able to as the workspaces are internal to your group. Anyone outside of the workspace will not be able to view the report of the map.
Using the dashboard or report in a mobile environment will limit you to a standard level account only. However, a Power BI workspace is by far the most robust way to share your report to your team and organization in the Power BI environment and has the fewest limitations when using ArcGIS for Power BI.
Let’s move onto the second method of sharing a report: embedding.
Embedding a report
The following are prerequisites for embedding a report with Power BI Online:
1. You must have a Power BI Pro or Premium license to create and view embedded reports.
2. You must sign into the Power BI report using your Power BI credentials.
3. Sign-in credentials are not automatically refreshed and are based on the organization’s login settings.
The following are prerequisites for embedding a report with ArcGIS for Power BI:
1. You must create and save a map with an ArcGIS Online or ArcGIS Enterprise creator account.
2. Reports that contain secure content must sign in with an ArcGIS Online or ArcGIS Enterprise viewer account.
3. Sign-in credentials are not automatically refreshed and are based on the organization’s login settings.
4. Additional map requirements (detailed in this section) are needed before embedding the report.
5. ISV environments are not supported.
Benefits of embedding a report in ArcGIS for Power BI
As a report designer, you may want to share your report on an internal web page, such as a SharePoint site. This is the next level of sharing your report and dashboards (after working on them in your workspace) across your organization.
Embedding is the process of adding a Power BI report, dashboard, or tile to an external application or website. It allows users to view and interact with Power BI content without leaving the application or website.
What makes this different from a workspace is that you can now share reports with your entire organization, including those who are not part of your workspace but have access to Power BI in some other capacity. For example, someone may work for Company ABC and have access to Power BI but not be in the same department as the report creator. Your team may want to share information about your company’s growth in the last quarter on a company-wide SharePoint page. This map can contain data such as latitude and longitude values as well as private layers from your ArcGIS organization.
The same processes apply for creating a report with the ArcGIS for Power BI component; however, the map must be created with an ArcGIS account and must meet certain requirements before it is embedded.
Considerations when embedding a report using ArcGIS for Power BI
As a general note, this process is aimed toward reports that will live on an internal or private website (like a SharePoint page). ArcGIS for Power BI is currently not supported in an ISV environment. An example of this environment would be using the Power BI Playground to develop a Power BI report. Further, Power BI reports that contain an ArcGIS for Power BI component cannot be used in a Power App.
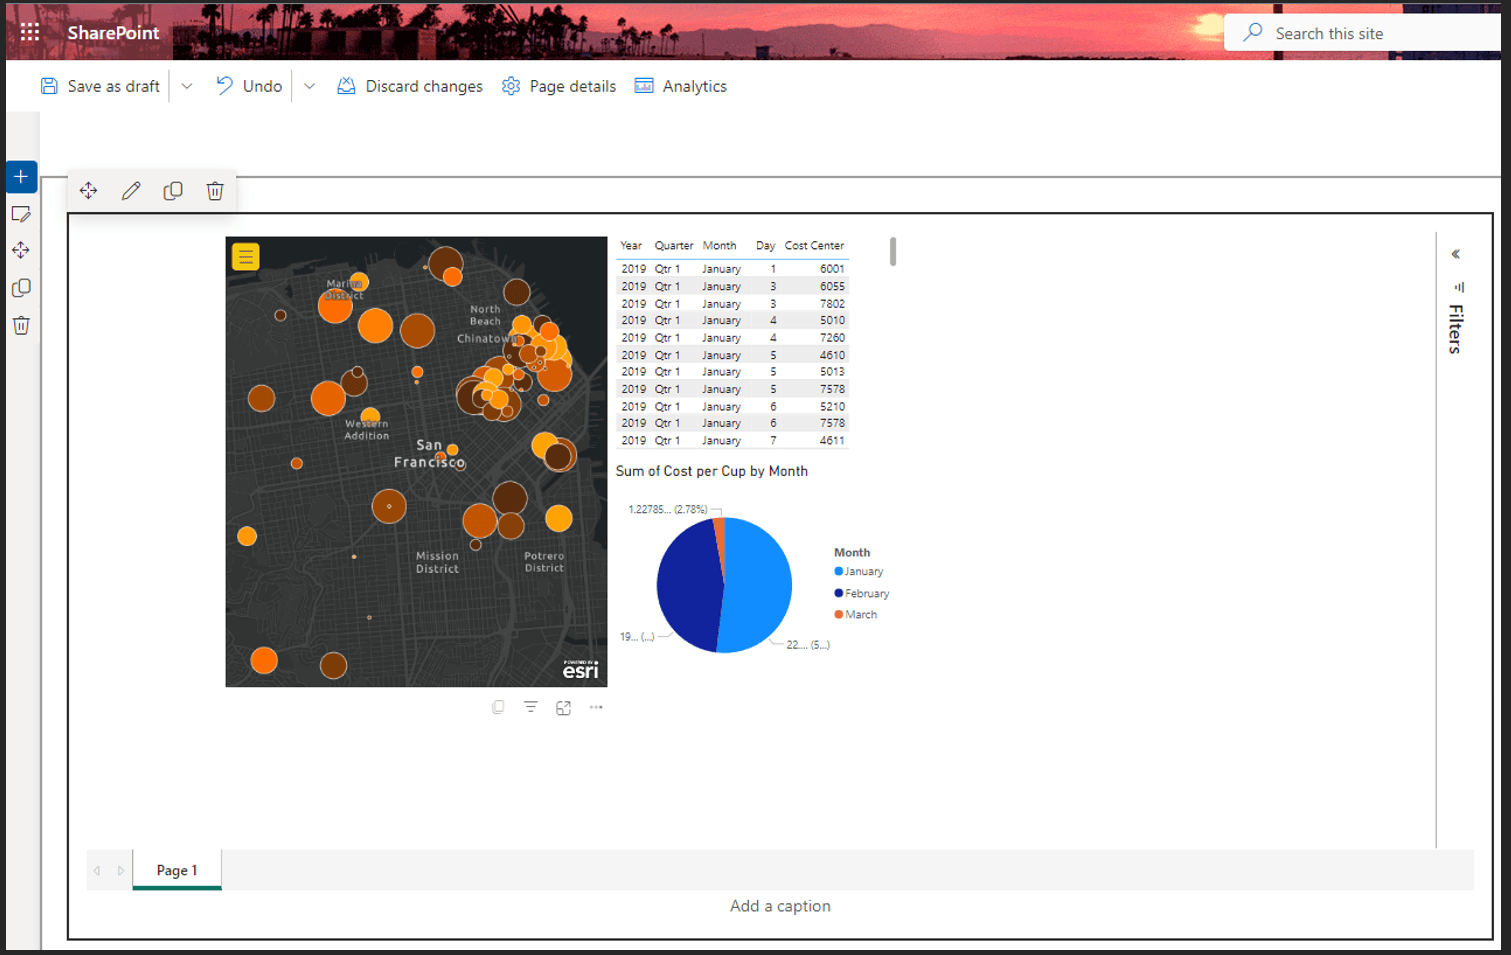
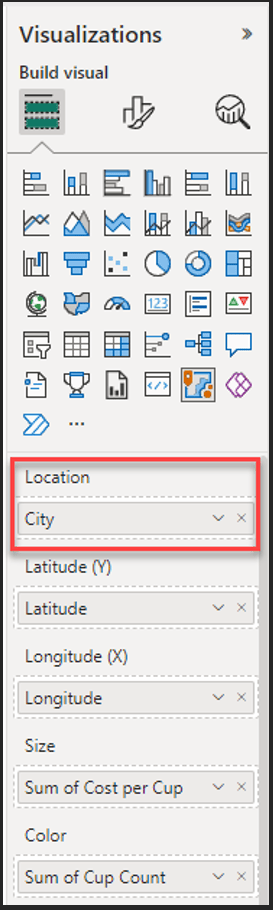
In some instances, you can filter data using all the available field wells in a Power BI visualization. In ArcGIS for Power BI, it is recommended that you use only one field well (or two if you are using the latitude and longitude field wells) to display your data. Having a combination of both the location and XY field wells will result in a map that does not meet requirements.
Here is an example of filtering the X and Y locations using City as a filter in the location field well. This will not meet the requirements for embedding a report.
Breakdown of requirements when embedding a report with ArcGIS for Power BI
Unlike sharing to a workspace, the ArcGIS for Power BI component has much stricter requirements when embedding the report. Review the list below when considering this method of sharing:
The following are prerequisites for embedding a report with ArcGIS for Power BI:
1. Reports must be created and saved while signed into a valid ArcGIS account with a Creator-level role and type or higher.
2. If the ArcGIS for Power BI visual contains private data, they must also sign into ArcGIS.
3. Power BI data used to create the ArcGIS for Power BI map can use latitude and longitude coordinates or EsriJSON for locations.
4. If the Location field well is used, it must only contain EsriJSON values. If the location field well is used and contains addresses or standard boundaries, publishing to the web will not work and will be blocked when attempting to view the report.
5. An embedded map can contain a maximum of 30,000 locations.
Considerations when embedding a report
This method of sharing is useful if you want to convey information across your organization rather just in your workspace. There are additional licenses and permissions needed to move your report or dashboard from your workspace to the embedded environment. However, once the report is embedded, you can continually update and refresh the content directly from Power BI Desktop or Power BI Online by saving and republishing it to the Power BI Online environment.
Further, Power BI is meant to provide a quick and effective method of reporting and visualizing data. It is recommended that keep your data concise and filtered accordingly. While it is possible to have up to 30,000 locations on the map, it is recommended to keep that number lower to help provide beneficial context and meaning to the map alongside your Power BI visualizations.
For a step-by-step workflow on how to embed your report, visit the Embed a map-enabled report help topic.
Publishing a report
The last method of sharing is publishing a report to a public page.
The following are prerequisites for embedding a report with Power BI Online:
1. You must have a Power BI license to publish from your own workspace.
2. You must have a Power BI Pro or Premium license to publish a report from a group workspace.
3. The publish to web option must be enabled by the Office 365 administrator for your tenant.
4. To embed a report with ArcGIS for Power BI, you must create and save a map with an ArcGIS Online or ArcGIS Enterprise creator account.
Benefits of publishing a report with ArcGIS for Power BI
The last method of sharing a report in Power BI is using the publish to web method. Publishing is the process of making a Power BI report, dashboard, or tile available to other users. It allows users to share their work with others and collaborate on data analysis.
As a report designer, you may want to share your report out to people outside of your workspace and organization. For example, you can share a Power BI report through a blog post, email, social media, and so on.
The idea behind this method is that everyone can view the report even if they do not have a Power BI login or an ArcGIS for Power BI login. Meaning, all the data that exists on the report is considered public and can be viewed by anyone. Reports at this level are meant to be easily read by its viewers and give a high-level overview of a given subject. For example, publishing a report based on COVID-19 cases over the course of a week would be useful in a published setting.
The same processes apply for creating a report containing the ArcGIS for Power BI component; however, the map must be created with an ArcGIS account and must meet certain requirements before it is published.
Considerations when publishing a report using ArcGIS for Power BI
The following are prerequisites for publishing a report with Power BI Online:
1. When using Power BI Online, all data is public, and the report must not contain any private data.
2. This option might not be available for all users as it requires tenant-level settings to be enabled.
The following are prerequisites for publishing a report with ArcGIS for Power BI:
1. You must create and save a map with an ArcGIS Online or ArcGIS Enterprise creator account.
2. The map’s data must be public, and no private or secure data is allowed.
A major limitation of this method is that publishing might not be available to all users of Power BI as it requires tenant-level settings to change. Some organizations might not want any of their data to be public. In this case, it is recommended to embed a report to an internal page so that secure data will not be made public.
In some instances, you can filter data using all the available field wells in a Power BI visualization. In ArcGIS for Power BI, it is recommended that you use only one field well (or two if you are using the latitude and longitude field wells) to display your data. Having a combination of both the location and XY field wells will result in a map that does not meet requirements.
Here is an example of filtering the X and Y locations using City as a filter in the location field well. This will not meet the requirements for publishing a report.
Breakdown of requirements when publishing a report with ArcGIS for Power BI
The requirements for publishing a report that contains ArcGIS for Power BI are very similar to embedding and much stricter than sharing to a workspace. Review the list below when considering this method of sharing:
Requirements for publishing a report that contains ArcGIS for Power BI:
1. Reports must be created and saved while signed into a valid ArcGIS account with a Creator-level role and type or higher.
2. The ArcGIS for Power BI component cannot contain any private data.
3. Power BI data used to create the ArcGIS for Power BI map can use latitude and longitude coordinates or EsriJSON for locations.
4. If the Location field well is used, it must only contain EsriJSON values. If the location field well is used and contains addresses or standard boundaries, publishing to the web will not work and will be blocked when attempting to view the report.
5. A published map can contain a maximum of 30,000 locations.
Considerations when publishing a report
This method of sharing is useful if you want to share a report outside of your organization and is independent of having a Power BI or ArcGIS license (for viewing). As with the other methods of sharing, the report designer can refresh the data by saving and republishing it to the Power BI Online environment.
However, publishing a report will require a report designer to maintain embed codes. This could get a bit hectic if your organization publishes reports frequently or has multiple reports shared across many different locations.
Further, Power BI is meant to provide a quick and effective method of reporting and visualizing data. It is recommended that you keep your data concise and filtered accordingly. While it is possible to have up to 30,000 locations on the map, it is recommended to keep that number lower to help provide beneficial context and meaning to the map alongside your Power BI visualizations.
For a step-by-step workflow on how to publish your report, visit the Publish to web help topic.
Summary
You now have a variety of sharing methods as tools in your reporting toolbox. While there are multiple ways to share reports in Power BI, one method does not necessarily supersede the others. Finding the right balance between the amount of data on the report page, what you want to convey to your viewers, and what environment to share it in will ultimately determine the best method for sharing. You may find that one of these methods or all of them work for your organization. Power BI and ArcGIS for Power BI have many uses, and together, they can help you combine your GIS and BI data.
Article Discussion: