3D mapping and cartography have applications across a broad swath of industries and in government and academia. The examples featured here hint at the possibilities.
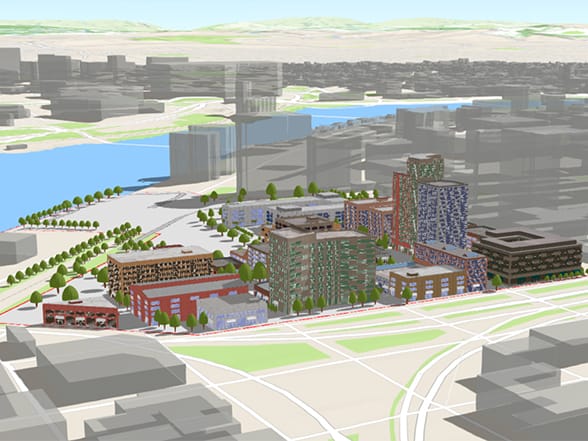
Urban Planners
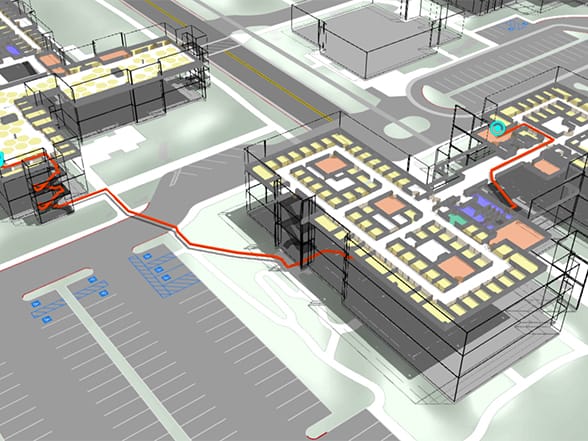
Building and Facility Managers
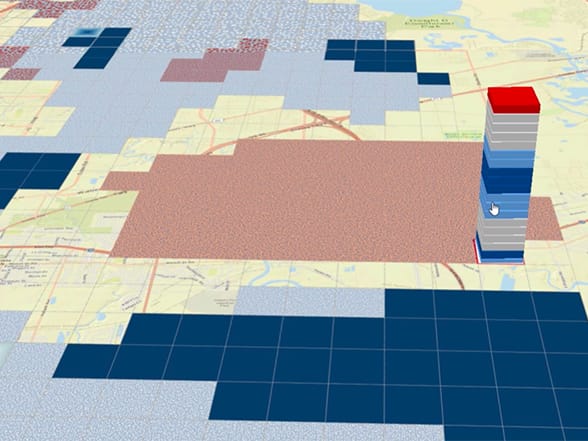
Social Scientists
Here are some things to help you get started taking your maps into the third dimension.
The ArcGIS Scene Viewer
The basic ArcGIS scene viewer allows you to work immediately in 3D space. It functions with desktop web browsers that support WebGL, a web technology standard built into most modern browsers for rendering 3D graphics.
ArcGIS Earth
This interactive globe lets you explore the world. Quickly display 3D and 2D map data, including KML, and sketch placemarks to easily understand spatial information. Download it here.
3D in ArcGIS Pro
ArcGIS Pro is a modern 64-bit desktop application that has extensive 3D capabilities built in. You can work with 2D views and 3D scenes side by side.
CityEngine
CityEngine is an advanced tool for scenario-driven city design and developing rules for creating procedurally built cityscapes.
Terrain and Basemap Overlays
Each scene starts with a basemap draped on the 3D elevation surface of the world. Zoom to your area of interest and begin to add your operational overlays.
Understand the Purpose of Your Scene
Before you start designing your new scene, you need to know its purpose. What is the message or information you intend to convey?
The answer to that question will help you design many elements of your scene.
- For example: Does curvature of the earth help or hinder the message (global view versus local view)?
- Will thematic styling distract from or augment the GIS information (photorealistic vs thematic layers)?
- Do users need to zoom in close to the ground (minimum surface resolution)?
- What basemap do users need draped on the ground for context (imagery, cartographic maps, thematic)?
The key point is that each of your decisions should be rooted in why you are building the scene in the first place.
Learn ArcGIS Lesson: Create a 3D Web Scene
The beaches and inlets along the coast of Palm Beach County, Florida, contain a delicate ecosystem teeming with flora and fauna. However, beaches are unstable by nature. Beach sand is washed away by ebbing tides and occasional storms. Coastal areas require frequent restoration and maintenance. Sand is excavated, or dredged, from shallow areas or inlets to replenish eroded beaches, while artificial reefs are constructed to protect the shoreline. To manage these complex restoration efforts, proper monitoring and mapping is essential.
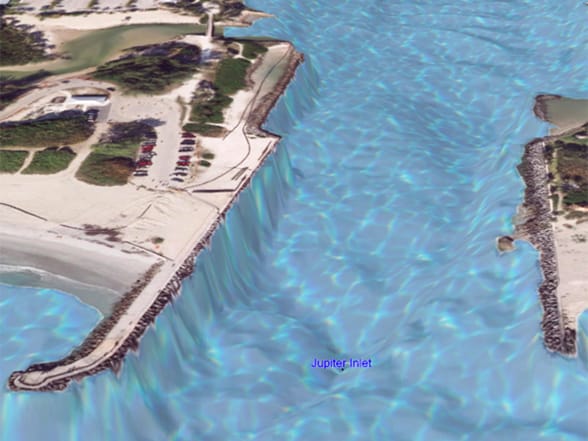
In this lesson, you’ll help the Palm Beach County beach restoration efforts by mapping some of the county’s major beaches and inlets as part of a presentation for both the public and policy makers. To emphasize bathymetric features and topography, you’ll create your map in 3D using the ArcGIS scene viewer. Begin by adding layers depicting reefs, sediment, and dredging areas to a new scene. Then capture slides of key areas so that users can quickly navigate to the locations you want to emphasize. Finally, create a web app to share with others.
Learn ArcGIS Lesson: Explore 3D Data with ArcGIS Pro
In this lesson, you’ll begin to analyze flooding in Venice. Known to locals as acqua alta, flooding in Venice is a tale of two elevations: the low elevation of the city and the high elevation of the lagoon during extreme tide levels. In the previous lesson, you worked with 2D data, but elevation adds a new dimension: height.
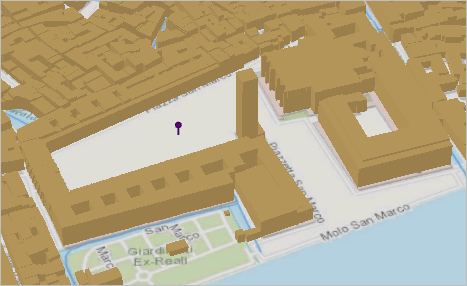
Your ultimate goal is to determine how much of Venice is affected at an exceptional tide, defined as 1.4 meters above sea level. To communicate your results in a meaningful way, you need to be able to visualize your 3D data. In this lesson, you’ll add a layer of elevation to your map. Then, you’ll convert your data into 3D to better understand Venice’s elevation—or lack thereof.

This post is excerpted from The ArcGIS Book, Second Edition: 10 Big Ideas about Applying The Science of Where, by Christian Harder and Clint Brown. The twin goals of this book are to open your eyes to what is now possible with Web GIS, and then spur you into action by putting the technology and deep data resources in your hands. The book is available through Amazon.com and other booksellers, and is also available at TheArcGISBook.com for free.
Commenting is not enabled for this article.