Challenge 1: Coloring In
Challenge 2: A Forest of Color
Challenge 3: Middle-Earth Your Neighborhood
Challenge 4: Adventure Awaits
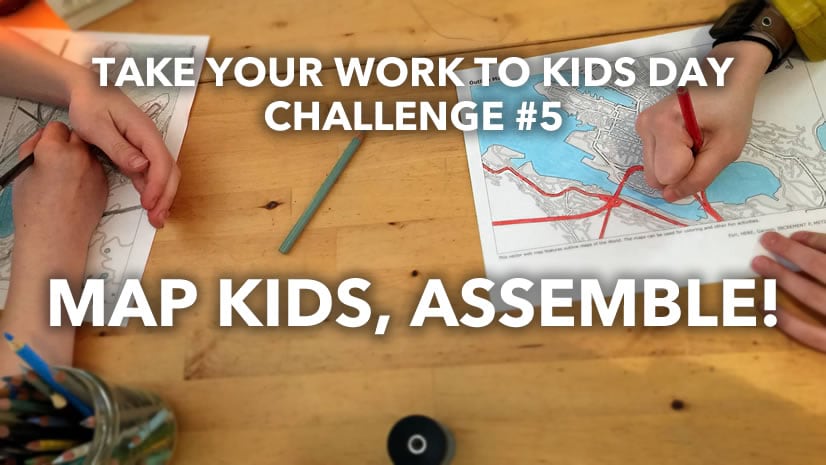
Challenge 5: Map Kids, Assemble!
Challenge 6: Living Atlas Cross-Stitch
Challenge 7: This one!
Download these maps and play connect-the-dots! Draw contour lines to make elevation maps of real places.
Click here to download the PDF.
I made these maps with kids in mind, but for all the grown-ups out there, I think you will find this challenge fun too! I’ve provided a range of difficulty in the maps.

What are the rules of the game?
- Connect the dots that have equal value
- Lines cannot touch or cross one another
- Lines can’t split in two or merge
- All lines must be closed loops or travel off the edge of the page (they can’t stop in the middle!)
So go ahead and print off some maps, grab a pencil (you’ll probably want an eraser too) and get mapping!
If you don’t have access to a printer, you can tape some paper (better yet, tracing paper) to your computer monitor instead.

The maps are ordered from easy to difficult. If they get too difficult, try pages 5-8. It’s a lot easier to spot the patterns when the dots have colors.

And if you want to see what the terrain really looks like, check out pages 9-12.
What are contour lines?
Many maps use contour lines to draw the elevation—or terrain—of a landscape. This is a great way to map landforms like mountains and valleys. Check out this beautiful map of Monument Valley in Utah, U.S.A.:

The letters in the map are pointing to the features labeled in this photo:

To learn more about this example, check out the original source from the David Rumsey Map Collection, as well as lots of other great contour-landform examples in the Atlas of Landforms.
Contour lines (sometimes called isolines) aren’t just used to map elevation. They can map other phenomena too, like weather or pollution.
How do cartographers make contour lines?
The maps in this activity are made with real elevation data, but I have simplified it to make the activity easier. Most data in the real world is complex and messy, and drawing contour lines by hand is really hard! Today we use tools like Contour to draw contour lines automatically.

If you want to try mapping elevation in ArcGIS Online, try the lesson Interpolate values from Learn ArcGIS.
Here’s the maps I made:


Article Discussion: