By Aileen Buckley, Mapping Center Lead
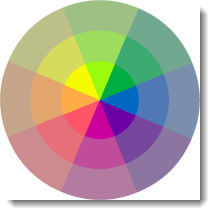
An aspect-slope map simultaneously shows the aspect (direction) and degree (steepness) of slope for a terrain (or other continuous surface). Aspect categories are symbolized using hues (e.g., red, orange, yellow, etc.) and degree of slope classes are mapped with saturation (or brilliance of color) so that the steeper slopes are brighter. This will result in a map that has the colors shown to the right.
NOTE — This blog entry has been updated for ArcGIS 10.
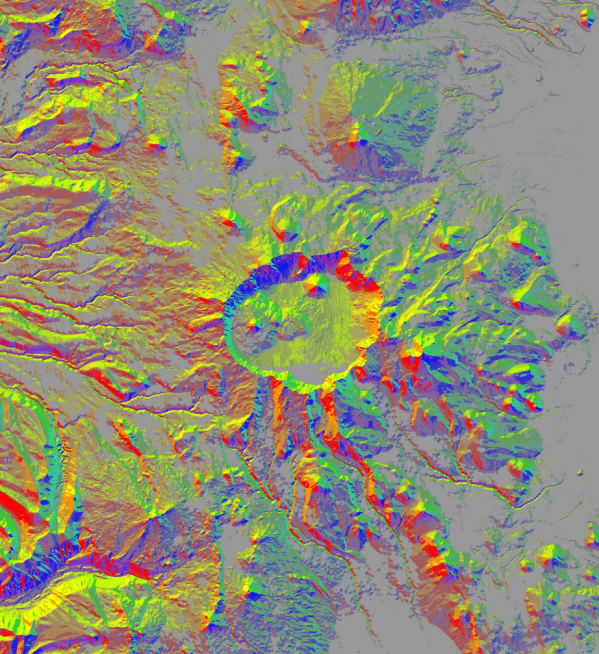
The coloring is based on Moellering and Kimerling’s MKS-ASPECT scheme (GIS world 1991). Below is the aspect-slope map for the area around Crater Lake, Oregon.
Cindy Brewer and Ken Marlow describe the process for making this kind of map using ArcInfo GRID in their online article, Color Representation of Aspect and Slope Simultaneously. Translating the instructions to ArcGIS 3D Analyst or Spatial Analyst is straightforward. To try this yourself, download this dataset. Included with the data is an .mxd file. Click here to download the style used to make the map above. These are the same colors Cindy and Ken originally used.
Here is how to achieve this effect yourself:
- First download the data and open the associated .mxd.
- Using Style Manager, reference the aspect-slope style. To make things easier, you can also “un-reference” the Esri style. If you have a lot of content in your personal style, you will have to wade through this when you want to use the aspect-slope style as there is no way to “un-reference” your personal style.
- Create a slope map from the Crater Lake DEM using the Slope tool (this is in ArcToolbox under Spatial Analyst Tools -> Surface). Use the PERCENTRISE option for the Output measurement.
- Create an aspect map from the Crater Lake DEM using the Aspect tool (also in ArcToolbox under Spatial Analyst Tools -> Surface).
- Reclass the slope map using the Reclassify tool (also in ArcToolbox under Spatial Analyst Tools but this time, not surprisingly, in the Reclass toolset). Use these categories:
0-5 : 10
5-20 : 20
20-40 : 30
40-highest value : 40 - Reclass the aspect map using the Reclassify tool. Use these categories:
0-22.5 : 1
22.5-67.5 : 2
67.5-112.5 : 3
112.5-157.5 : 4
157.5-202.5 : 5
202.5-247.5 : 6
247.5-292.5 : 7
292.5-337.5 : 8
337.5-359.5 : 1 - Combine the two reclassed grids into an aspect-slope grid using the Plus tool (this is in ArcToolbox under Spatial Analyst Tools in the Math toolset). The input rasters are the slope-reclass grid and the aspect_reclass grid. Call it “aspect-slope”. This will create a new output grid with values in the 20s for low slope areas, 30’s for medium slope areas and 40s for high slope areas. The numbers will range from 21-28, 31-38 and 41-48 where the last digit relates to the aspect orientation (with 1 being north, 2 northeast, 3 east, and so on). Numbers less than 20 are essentially flat areas and will be assigned a gray color.
- Now classify the results so that you can assign the appropriate colors:
- Right-click the aspect-slope grid in the Table of Contents.
- Click the Symbology tab.
- Under Show on the left side of the dialog box, click Classified.
- Under Classification, change the number of classes to 26 and click Classify. Use these numbers for the break values (the number on the left is the break value and the number on the right is the class number):
19 : 1
21 : 2
22 : 3
23 : 4
24 : 5
25 : 6
26 : 7
27 : 8
28 : 9
31 : 10
32 : 11
33 : 12
34 : 13
35 : 14
36 : 15
37 : 16
38 : 17
41 : 18
42 : 19
43 : 20
44 : 21
45 : 22
46 : 23
47 : 24
48 : 25
highest value : 26
- You are now ready to assign colors. These are the RGB colors in the aspect-slope style and their associated class in the aspect-slope grid:
19 : 161 161 161
21 : 152 181 129
22 : 114 168 144
23 : 124 142 173
24 : 140 117 160
25 : 180 123 161
26 : 203 139 143
27 : 197 165 138
28 : 189 191 137
31 : 141 196 88
32 : 61 171 113
33 : 80 120 182
34 : 119 71 157
35 : 192 77 156
36 : 231 111 122
37 : 226 166 108
38 : 214 219 94
41 : 132 214 0
42 : 0 171 68
43 : 0 104 192
44 : 108 0 163
45 : 202 0 156
46 : 255 85 104
47 : 255 171 71
48 : 244 250 0 - If you want to use the colors in the style that you downloaded, in the Table of Contents, click the color chip for each class and then hover over the color chips in the palette until you find the corresponding RGB values (a label will appear for each chip if you hover over it long enough).
- You can save yourself the time and effort of applying the colors one-by-one if you simply reference the colors in the aspect-slope layer that we put in the zip file for you. To use this:
- In the Table of Contents, right click the aspect-slope grid you created.
- Click the Symbology tab.
- At the top right, click Import.
- Select the aspect-slope layer.
The colors should now be appropriately assigned on your map.
To learn more about this mapping technique and this unique coloring scheme, check out the following references:
- Color Representation of Aspect and Slope Simultaneously, by Cynthia A. Brewer and Ken A. Marlow, available online at: http://www.personal.psu.edu/cab38/Terrain/AutoCarto.html.
- GIS World, 1991, MKS-ASPECT Enhances Color Surface Renderings, GIS World, 4(October): 30-32.
- Moellering, H., and A.J. Kimerling, 1990, A New Digital Slope-Aspect Display Process, Cartography and Geographic Information Systems, 17(2): 151-159.

Article Discussion: