By Aileen Buckley, Mapping Center Lead

We recently received a question about legends on Ask a Cartographer, so I thought we should post a blog describing some of the cartographic guidelines for legends that may help you make decisions about their design. Here are some tips — first related to page titles and legend titles, then some that are more general, and finally related to grouping items in legends:
Page Titles
- These should be clear, to the point — informative, but not wordy
- These should not be “Map of…”, “Distribution of…” since that is obvious and you are wasting the words for something that the reader already knows. For instance calling a book, “Book of”,or a report “Report of” — it is obvious what it is so there is not need to repeat that in the title).
Legend Titles
- Use these to further explain the map content – if your page title is getting too lengthy or wordy, consider using the legend title to describe an additional part of page title (e.g., Population under Age 20)
- Use the legend title to explain equations used to derive values (e.g., People per square mile)
- Use these to explain terminology (e.g. Cost per acre)
- In the case where the legend is describing a key to symbology, as on a USGS topo map, then you are probably showing a lot of symbology and the solutions noted above won’t work, in which case the legend is usually just called a “Key”
Legend Design Guidelines
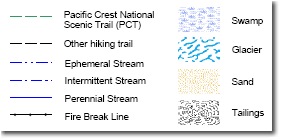
- Consider if there is really a need for the legend — whenever possible, it is desirable to eliminate the need for a legend altogether if you can mange to have the map carry the information. For example, if you have a single feature that is uniquely symbolized (e.g., a dashed green line for the Pacific Crest Trail on the Crater Lake map then simply labeling the feature eliminates the need to include it in the legend. Likewise, features that are symbolized and labeled in such a way that they are obvious need not be included in the legend (e.g., labeled county lines, labeled roads such as interstates.) However, any potentially ambiguous symbology should be included in a legend (e.g., secondary versus primary roads).
- There are simple to complex examples of legends — the important thing is to have them explain unclear symbology on the map. The examples shown are fairly simple legends. More complex ones would include more content (e.g., notes or descriptions of equations used in the analysis) or explain more complex symbology (e.g., multivariate symbols).
- Legends should ALWAYS explain symbology exactly as it looks on the map. Legend symbols should be exactly the same size, orientation, color, etc. as they appear on the map. A good example of when this rule is often broken is when transparency is used for polygons but the legend shows the colors without transparency (as is the default for legend symbology in ArcGIS) — in this case, the appropriate legend would be created in such a way that the transparency on the map is also used in the creation of the legend. Here is a blog entry that we wrote on the subject.
- Use simple outlines for the legend patches — that is, boxes for polygons, lines for linear features and of course the marker symbols for points. You can sometimes relate the legend patches to feature types — for example, use a curvy line or irregular polygon for hydrographic features and straight line or square box for cultural features (buildings, roads, etc.) since that is the way they occur in the landscape.
- If possible use the 3:5 (tall-to-wide) golden ratio rule for the legend area, legend boxes, etc. The human eye finds a 3:5 ratio more pleasing than others. Instead of using ovals or squares for the legend boxes, stick to the more familiar and pleasing 3:5 ratio, if you are unsure or want to be cautious.
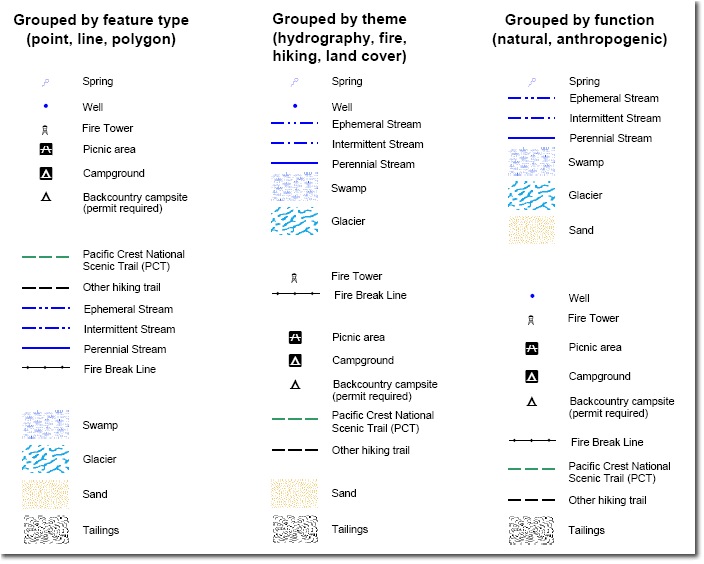
When it comes to grouping legend items, if you have a variety of feature types (as on topographic or other reference maps) there are a number of possible solutions:

References:
- Brewer, Cynthia A. 2005. Designing Better Maps. Redlands, CA: Esri Press, 202 pages, ISBN-10: 1589480899, ISBN-13: 978-1589480896.
- Robinson, Arthur H., Joel L. Morrison, Phillip C. Muehrcke, A. Jon Kimerling and Stephen C. Guptill. 1995. Elements of Cartography, Fifth Edition. New York, NY: John Wiley & Sons, Inc., 674 pages, ISBN 0-471-55579-7.
- Slocum, Terry, Robert B. McMaster, Fritz C. Kessler, and Hugh H. Howard. 2005. Thematic Cartography and Geographic Visualization, Second Edition. Upper Saddle River, NJ: Pearson Prentice Hall, 518 pages, ISBN 0-13-035123-7.

Article Discussion: