By Aileen Buckley, Mapping Center Lead, and Jeremy Wright, John Cranfill, and Michael Grossman, Product Engineers
There are three primary building blocks of standard symbols in ArcGIS—fonts, colors, and graphic files. In a previous article, we discussed fonts in ArcGIS symbols, and in an upcoming article we will tackle the issue of pictures. In this article, we discuss colors in ArcGIS symbols, including color models and how they are used to define colors in ArcGIS, and the differences between their color gamuts. We wrap up with a set of tips for working with color in ArcGIS.
Color models
The first thing to understand about colors in ArcGIS symbols is that they are defined using a color model, which is a system for specifying colors numerically according to their individual components. A color model is visualized as a three-dimensional space that contains all possible combinations of the model’s primary colors.
The RGB color model
An RGB color space is created by mapping its primary colors—red, green, and blue (RGB)—into a 3-D Cartesian coordinate system. This results in a 3-D cube like the one shown in figure 1.
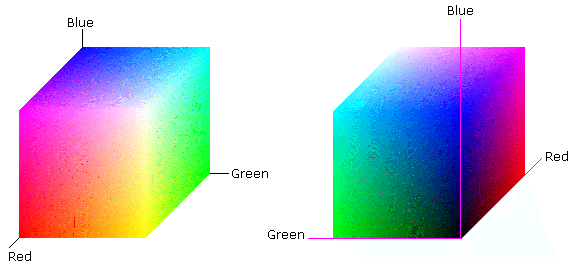
Figure 1. The RGB color model
With its primary colors at three corners, the secondary colors—cyan, magenta, and yellow (CMY)—in addition to black and white, are assigned to the remaining corners.
The values for RGB range from 0 to 255 for each dimension, yielding 2563 (16,777,216) possible colors. In this color model, black is defined as (0,0,0) and white as (255,255,255). Gray is scaled along the diagonal line between the two opposing corners between black and white.
RGB is an additive color model because it describes what kind of light needs to be mixed together (emitted) to create the various colors. In this color model, the combination of all colors is white (figure 2).
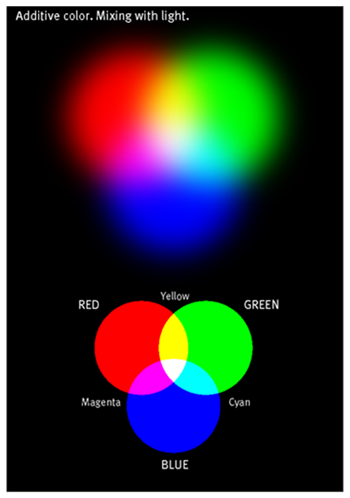
Figure 2. The primary colors of the RGB color model are red, green, and blue, and the combination of all colors is white (from AM Tait’s Ten quick references for map makers)
This model is used for electronic devices that emit light of different colors, such as smart phones, computers, and televisions.
The CMY and CMYK color models
The CMY color space is based on a subtractive color model which describes what kind of inks need to be mixed together so light reflected from the surface and through the inks produces the various colors.
A CMY color space can also be visualized as a cube with its primary colors (cyan, yellow, and magenta) at three corners, and its secondary colors (red, green, and blue) along with black and white, at the other corners (figure 3).
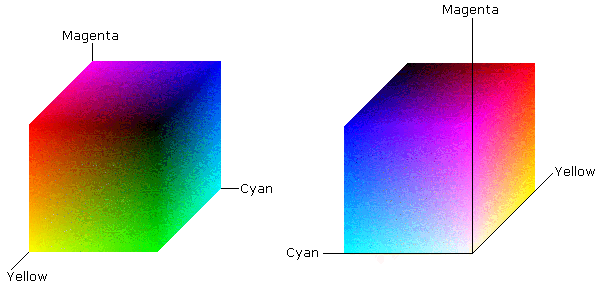
Figure 3. The CMY color model
Values for the primary colors of this color model are expressed in percentages and range from 0 to 100. In this color model, the combination of all colors is black (figure 4).
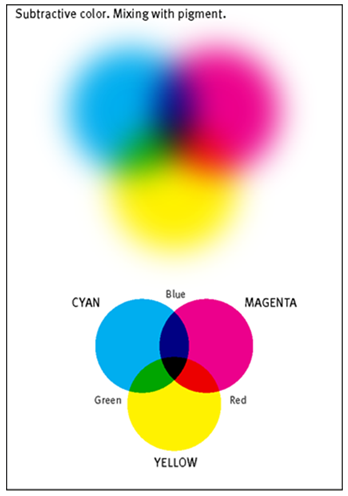
Figure 4. The primary colors of the CMY color model are cyan, magenta, and yellow, and the combination of all colors is black (from AM Tait’s Ten quick references for map makers)
The CMYK color space, a variation on the CMY model, adds black. This color model is used in color printing, and its name reflects the four common components of ink formulas used by some printers and plotters.
The HSV color model
Another color model that ArcGIS supports is HSV (hue, saturation, and value), which can be visualized as a cone in a cylindrical coordinate system (figure 5). HSV is actually just a rearrangement of the geometry of the RGB color model in an attempt to be more intuitive and perceptually relevant than the Cartesian (cube) representation.
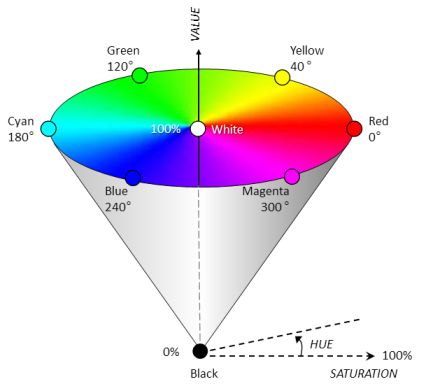
Figure 5. The HSV color model
In this color model, the primary and secondary colors are arranged around the circle that represents the top of the cone, so that the hue dimension of color (what we commonly think of as “color”, such as red, orange, or yellow) can be expressed as angles varying counterclockwise from red at zero. The saturation dimension of color, which is the extent to which it departs from a neutral color such as gray, or in simpler terms, its “colorfulness”, ranges from 0 percent (gray) at the middle to 100 at the face, or curved surface of the cone’s exterior, where the colors are fully saturated. The value dimension of color, or the intensity of white in the color, ranges from zero percent (black) at the tip of the cone to 100 percent at the top. Gray tones fall along this vertical axis.
Defining colors in ArcMap
In ArcMap, you will use one of these models to define colors in the Color Selector dialog box. You can switch between color models by selecting a different model from the drop-down menu (figure 6).
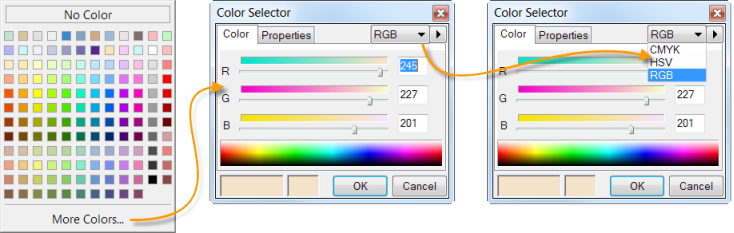
Figure 6. Changing colors models in the Color Selector dialog box
You can use the Advanced Selection option to modify the colors using a graphic representation of the color space (figure 7).
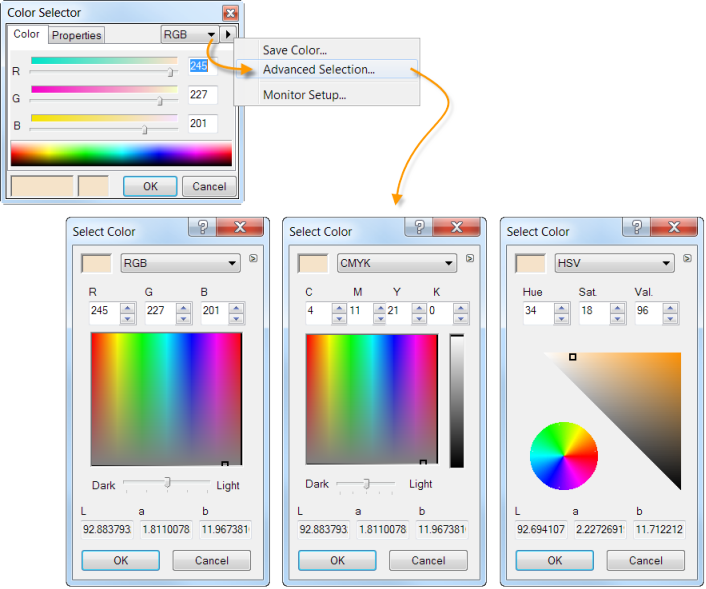
Figure 7. You can also modify colors using a graphic representation of the color space
Recommendations for defining colors in ArcGIS
You should consider defining colors in a way that matches your intended display mode. Use RGB to define colors for a map that will be primarily viewed on-screen: shared on ArcGIS.com or via an ArcGIS Server instance, or viewed in a PDF on a mobile device. Use CMYK to define colors for a map intended for printing or that will be sent to a service bureau for reproduction.
The HSV color model is good to use when you want to change one component of color. In many cases, this is the easier way to modify a color because it is simpler to understand than trying to change the red, green, blue, cyan, magenta, yellow, or black components of color. Then, once you have defined a color using the HSV color model, you can convert it to RGB or CMYK, depending on how your map will be viewed.
Although you can easily switch between color models, you should be aware that you may not always see exactly the same color if you switch between RGB/HSV and CMYK. The reason is that these two color spaces don’t have equivalent “gamuts”.
Color gamuts
Although any color model can theoretically be used to create any color, each color model has its own gamut. A color gamut is a certain complete subset of colors that can be accurately represented in a given circumstance, such as with a certain color model and/or output device.
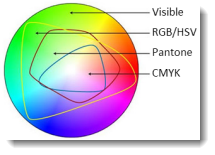
These RGB/HSV and CMYK color models are just ways of numerically representing actual light—either transmitted or reflected to your eye. They both can describe a subset of the visible spectrum, but they can’t reproduce the same subset of the visible spectrum. Figure 8 is a visualization of variations in the gamuts of selected color models.
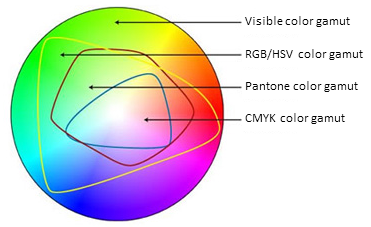
Figure 8. The print gamuts in the visible color spectrum for select color models (from http://www.printernational.org/rgb-versus-cmyk.php)
RGB and CMYK models are “device dependent” color models. This means that, as numeric representations of real colors, they will be interpreted by the devices they are displayed or printed on. This interpretation varies from device to device, so the same RGB numbers can yield very different color appearances when viewed on two different monitors, for example.
The capabilities of display devices will affect the color gamut as well. For RGB, a monitor with a better backlight and LCD panel may have a broader gamut than a cheaper consumer grade one. That’s why people pay for fancier monitors when they’re doing graphic design all day than if they’re just surfing the web occasionally.
In general, it can be said that the CMYK color model has a smaller gamut than the RGB color model, and that printing devices have a more restricted color gamut than does a television, which is more restricted than an LCD screen, which is more restricted than photographic film, which is more restricted than laser video projectors. In printing, the color gamut in printing is affected by many factors, including the ink formulation, printing process, substrate, and halftoning or lay down technique.
Tips for working with color in ArcGIS
- You can define a color using any of the supported color models. The color object is tagged with the model that was originally used to define it.
- Switching from CMYK to RGB is not always lossless. Neither is RGB to CMYK. If you define a CMYK color that’s out of the gamut for RGB, you will lose the color fidelity. In figure 8, the areas where the RGB and CMYK gamuts don’t overlap are colors that will result in color loss, technically called “burning” or “clipping” the gamut.
- If you convert from one model to another more than once (e.g., RGB to CMYK, then back to RGB), you may notice that the conversion is lossy in terms of precision. The reason is that CMYK channels are stored as integers between 0 and 100, and we store RGB channels as integers between 0 and 255. Thus, RGB has more increments, and those are lost when you convert RGB to CMYK. CMYK to RGB to CMYK will maintain precision, but the K channel comes out as 0 because it can’t be reliably reconstructed from RGB numbers.
- The export options in ArcMap allow you to convert a map whose colors are defined in RGB to CMYK, but because the gamuts of these two color spaces are different you may not get the expected results.
- Raster in ArcMap is always output by first drawing it using RGB, but in changing the destination color space to CMYK, ArcMap will attempt to convert these RGB values to CMYK during the output process. Because of the imperfect conversion (see the second bullet above) even if your raster symbolization uses CMYK colors, you can’t always expect to get the same CMYK values on output.
- Your plotter will convert your RGB colors to CMYK (or even more colors, depending on the printer/plotter) inks. Because of this, you may see some change in colors between what is displayed onscreen and what you see on paper.
- If you’ll be printing to your own plotter or printer, there are a couple of calibration map documents (MXDs) included with ArcMap that may help you reconcile the colors you see on screen with the colors your plotter produces. In your ArcGIS installation folder under the Plotters directory (e.g., C:Program Files (x86)ArcGISDesktop10.0plotters) are calibrate.mxd and CMY_PlotterCalibrate.mxd. These MXDs are page layouts containing many of the standard colors in the styles included with ArcGIS. You can print these on your target plotter or printer and use them as a reference when defining colors in your maps to be printed.
- Try to manage your colors in Style Manager. If you want to create a new color, create it by defining it in Style Manager. If you want to redefine it using a different color model, the best thing to do is create a new color in the Style Manger and delete the old one. The reason is that if you change the color interactively, ArcGIS will convert the colors numerically, but the color that is tagged to the color object won’t be changed.
- Sometimes we are asked why the color numbers change if you convert from one color model to another and then back again. This Knowledge Base article explains that colors in ArcMap are internally stored using yet another color model called CIELAB. Each time you convert from one color model to another, there is a slight loss of information because CIELAB is stored using a “double” +/- 1.7e +/- 308 (˜15 digits) and CMYK and RGB values are stored using integers that are limited to whole values. So some rounding may occur each time you convert from one color model to another. There is a solution—simply close your ArcMap session and reopen it. The original color definition will be shown—remember, it’s because the color object has the original color definition tagged to it.
To learn more
Here are some online help topics that will allow you to learn more about color in ArcGIS symbols:
- Working with color—ArcGIS 10.1 Online help
- Can the color space be set to HSV or CMYK by default in ArcMap?—This article discusses how symbols are tagged with the color space used to create them.
- Export from ArcMap with CMYK colors to PDF, EPS, Illustrator, or SVG—This article enumerates some of the gotchas when exporting to CMYK from ArcMap, including what happens to raster data. This is important to know if you plan to export to CMYK for printing at a service bureau, for example.

Article Discussion: