By Aileen Buckley, Mapping Center Lead
Need to add a quick locator map to your page layout? Want to spice things up a bit? Try this locator map – it has visual appeal because of the 3D appearance (promoted by the choice of projection and the gradient fill). There are just a few basic steps to creating this map: 1) Prepare the data to make the map, 2) create the map, 3) add your area of interest (optional), and 4) export the data used to make the map, if desired (this will save some drawing time for you.)
Note that this is a technique you would want to use only if your area of interest is large enough to be seen on the map, and it is best used when you want the map reader to get an idea of where in the world your area of interest is located.
Prepare the data
- Get these data from Esri Data and Maps CD: World30 (this is the graticule for the world in 30 degree increments and the path to the data is dm_stmap_dvdworlddataworld30.sdcworld30), Country (this is a generalized country polygon feature class and the path to the data is dm_stmap_dvdworlddatacountry.sdccountry).
- Dissolve World30 using the Dissolve tool (this is in the Data Management Tools toolbox, and it is located in the Generalization toolset). Use the Dissolve tool to create a feature class that has the extent of the world but no graticule lines. Call it World30_dissolved. This will be the polygon feature class that you will symbolize with a gradient fill.
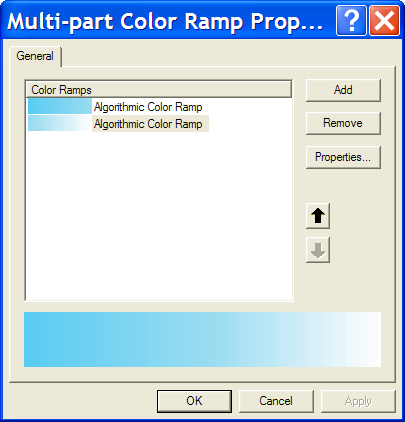
- Create the color ramp that you will use to symbolize the ocean (this is actually the World30_dissolved feature class that you created in the previous step). This should be created as a multi-part algorithmic color ramp with two parts:
- Top part Color 1 – HSV 195, 64, 95; Top part Color 2 – HSV 195, 38, 95.
- Bottom part Color 1 – HSV 195, 38, 95; Bottom part Color 2 – White (HSV 0, 0, 100).
To create a new color ramp, from the top menu bar, click Tools > Styles > Style Manager. On the left hand side of the dialog, expand your personal style (or the style in which you want to create this color ramp) and highlight the Color Ramps folder. On the right hand side of the dialog, right click anywhere in the white space and click New > Multi-part Color Ramp. In the Multi-part Color Ramp Properties dialog, click Add and click Algorithmic Color Ramp. Click Add again to add one more algorithmic color ramp. Highlight each color ramp and click Properties to assign the color values listed above.
Create the map
- Add all the data to a data frame and arrange the layers in this order from bottom to top: 1) World30_dissolved, 2) Country, 3) World30.
- Symbolize the data as follows:
- World30 – Fill color: No Color; Outline color: 80% gray, Outline width: 0.40 points
- Country – Fill color: White; Outline color: No Color
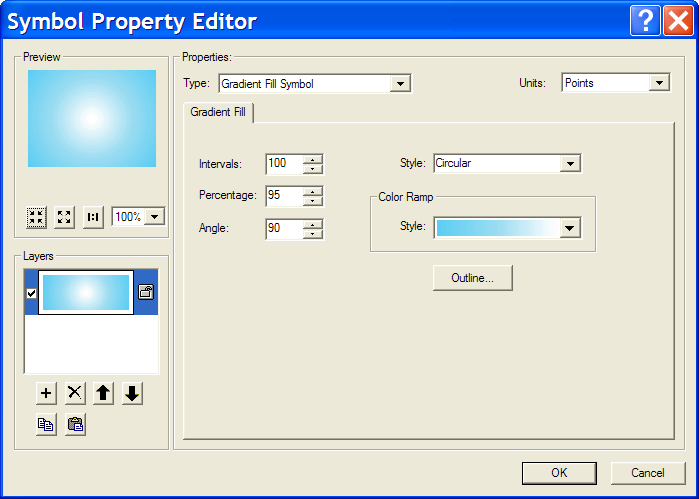
- World30_dissolved – Gradient Fill Symbol, Intervals: 100, Percentage: 95, Angle: 90, Style: Circular, Color Ramp: The color ramp you created to fill the ocean.
- Project and symbolize the data frame:
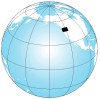
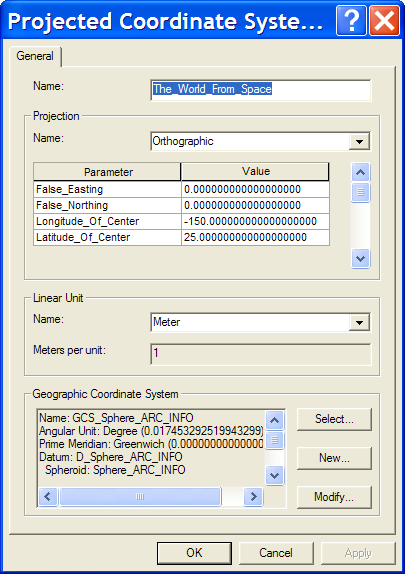
- Use the World from Space projection (this projection is in the Projected Coordinate Systems folder, in the World sub-folder).
- Make the following modifications to the longitude of center and the latitude of center to show the western seaboard of the U.S. (you can modify the latitude and longitude of center to show other locations on the Earth): Longitude of Center: -150.0, Latitude of Center: 25.0. To make these modifications, on the Data Frame Properties Coordinate System tab click the Modify… button after you have selected the World from Space projection.
- Set these data frame properties: Frame – Border: None; Background: None
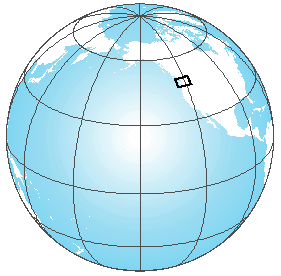
Add your area of interest (optional):
There are two ways to do this – with a feature class that uses a Definition Query or with an Extent Rectangle.
- Feature class that uses a Definition Query:
- Add the feature class to the locator map data frame.
- Write a Definition Query to ONLY display the feature (or features) of interest.
- Symbolize with: Fill color: Black; Outline Color: Black, Outline Width: 1 point (you can vary this depending on how well you can see the features on your map – a wider outline will show smaller features more clearly, but don’t make the line so wide that you exaggerate the location too much — you don’t want to give the impression that the area is massively larger than it really is.
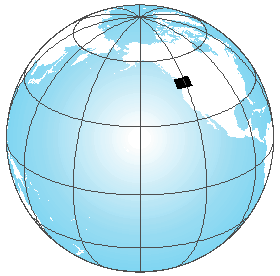
- Extent Rectangle:
- Add an Extent Rectangle for another data frame to show its location on your locator map.
- Use these frame properties: Border: 1.0 point, Color: Black.
Export the data (optional)
- Right click each feature class in the projected locator map data frame and click Data -> Export Data.
- Select the option to Use the same coordinate system as: the data frame, and click OK.
- Do not add the exported data to the map as a layer.
- For each layer in the locator map data frame, right click the layer, click Properties, click the Source tab, click the Set Data Source button and select the exported data that has the data frame’s projection.
Hopefully, you now have a nice looking locator map for your main map!

Article Discussion: