By Charlie Frye, Esri Chief Cartographer
If you make zoning, soils, geology, or any of a number of kinds of maps where your data represent many different types of features, you can make use of some specialized functionality in the unique values symbology method in ArcMap’s layer properties symbology tab. This functionality allows you to create headings within your layer’s symbols that will be shown in ArcMap’s table of contents and in your map’s legend. Headings provide a shortcut for assigning symbology and add some hierarchy to your table contents. Legend headings, at a minimum, help visually organize the information in the legend, and if your legend uses multiple columns, you can set the column breaks to occur at the headings- this makes the legend easier to read.
There are two cases, depending on how your data are organized, where the unique values headings functionality will help. First is a case like zoning where you may have between 20 and 50 classes of zoning; in this case, the goal is to better organize the presentation of those classes by adding some hierarchy to how your layer appears in the Table of Contents and the legend. In this first case, you can also benefit from using the Match to Symbols in a Style option for symbolizing Categories; this automates the assignment of your symbology. Once you use this option, all that remains is to assign the headings, which will represent, for the zoning example, the major types of zoning, e.g., commercial, residential, public, etc.
The second case is like geology where each map effectively has a unique set of feature types, and you may have between 20 and 100 different feature types on a given map,though your data may have more than 1,000 different kinds of features. That is the map will be showing fewer than the total number of possible feature types. For databases with an excessive number of different kinds of features, the Match to Symbols in a Style option is not going to be a time saver. Instead, setting a different color scheme for each heading is preferred. For the geology example, the idea is to show surface geology units by age category (quaternary, cretaceous, etc.) using groups of colors that have a narrow hue range (see the geology 24K.style for examples). The reason this works well is based in how the color schemes are applied to unique values symbology. ArcMap chooses colors from the within the color scheme that are as different as possible, making for a visually distinctive result. If you don’t like the result, just pick the same color scheme again, and you’ll get a different solution because the first color is assigned randomly so different color assignments are made each time the color scheme is reapplied.
Here is how to add headings to your unique values symbology:
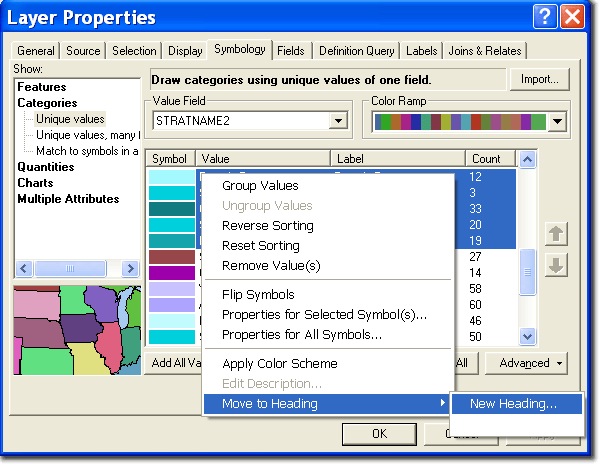
1. Create unique values symbology for your layer and then, while still in the Layer Properties window’s symbology tab, select several rows that represent features that belong in a specific group. Right-click on any of the selected rows to see the options that are shown below and choose Move to Heading, then New Heading. You can use Ctrl-Click to select multiple rows or Shift-Click to select a range of rows.
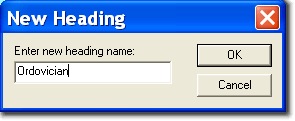
2. Enter the name of the heading that you want to display in the table of Contents and the legend in the resulting dialog box:
3. Repeat Steps 1 & 2 as needed to create additional headings.
Tips:
- When working with data that has many categories and types of features, it is often more productive to turn off the graphic view of the color ramps and use the names; so a good practice would be to name your headings the same as the color ramps you will be using.
- You can select a heading and then click the buttons with the black up or down arrows to change the order that headings will appear in the legend.
- You can click twice on a heading in the list to change its name; the first click selects the heading, and the second click allows you to edit the name.
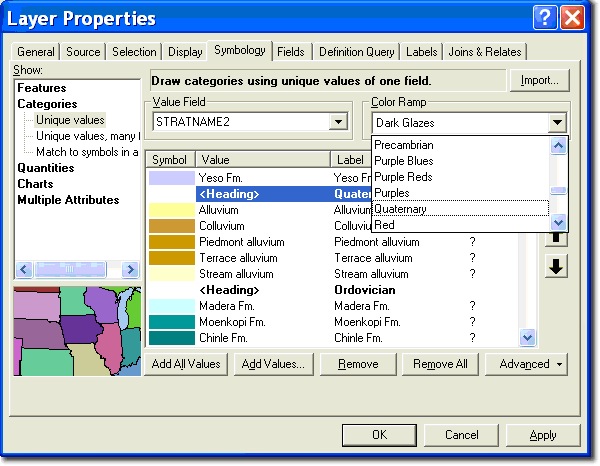
- Once your headings are set up and you’ve assigned all your symbols to the appropriate heading, you can select the heading to apply a color ramp to the symbol within just that heading as shown below:
Once you’ve created your legend, the way to ensure that the columns do not start except at headings is to edit your layer’s legend item properties. Here’s how to do that:
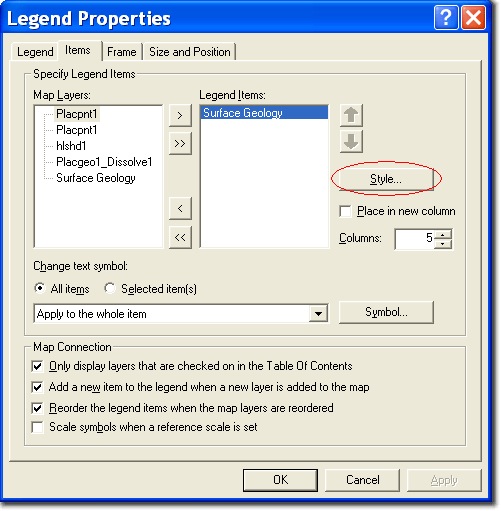
1. Start by editing the legend’s properties and then on the Items tab, select your layer and then click the Style button.
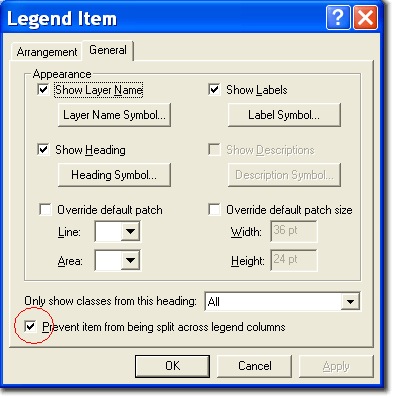
2. In the Legend Item Selector window, click the Properties button to show the following dialog. Check the option at the bottom to prevent items being split across legend columns.
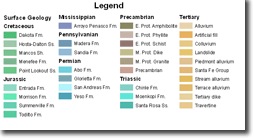
Here is an example of a legend for a surface geology layer that was constructed as described above:
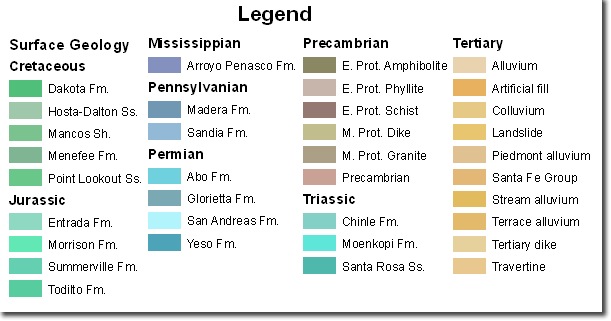
As shown above, you can also the Legend Item properties to set the fonts for the headings and labels, however, if you want to just change the font, select the entire legend and use the Font Color on the Draw toolbar. This will not alter the size or effects such as Bold or Italic.

Article Discussion: