By Mark Smithgall, Cartographic Product Engineer
Where can you find the largest island in the largest lake on the largest island in the largest lake on the largest island in the largest lake in the world? I stumbled across a rather unique Wikipedia factoid the other day: “When Moose Flats is temporarily submerged, Moose Boulder becomes the largest island in the largest lake [Moose Flats] on the largest island [Ryan Island] in the largest lake [Siskiwit Lake] on the largest island [Isle Royale] in the largest lake [Lake Superior] in the world.” This geographical tongue-twister led me to explore the Global Self-consistent, Hierarchical, High-resolution Shoreline Database (GSHHS) to see if this fact was true. I couldn’t actually confirm it using these data because they only contain enough detail to see ponds on islands in lakes on continents, but in the process I did find out what a great resource these data are, so I wanted to share that with you in this blog entry.
The GSHHS data set produced by the National Oceanic and Atmospheric Association (NOAA) includes 20 shapefiles. These data come in five levels of generalization: full, high, intermediate, low and coarse. For each level of resolution there are four types of content: land, lakes, islands in lakes, and ponds on islands in lakes. Although there is a dataset for the last type of data, ponds on islands in lakes, when you download it from NOAA, it is empty for the coarsest level of detail. This makes sense since the features are too small to show at the coarsest level of detail.
Figure 1 is an animation I made that shows the five levels of detail of the data for the island of Oahu, the most populous of the Hawaiian Islands. At a map scale of about 1:800,000 you can see that the second highest level of detail is probably the best data set to use.
Figure 1: An animation showing the five levels of detail for the island of Oahu, part of Hawaii, at roughly 1:800,000.
Figure 2 is an animation of the types of data contained in the GSHHS data sets. As the view zooms in, you can see the green land data, the light blue lakes, the brown islands, and the hatch patterned ponds on the islands.
Figure 2: An animation showing the four different types of content, focusing on Isle Royale in Lake Superior. The four map scales shown are: 1:27 million, 1:9 million, 1:3 million, and 1:1 million. The four types of content are easily distinguishable: green continents (Type 1), light blue oceans and lakes (Type 2), brown islands (Type 3) and hatch patterned lakes on islands (Type 4).
It is worthwhile to note that NOAA also distributes files with political boundaries and river lines that you can use with the GSHHS data. These data were derived from the World Data Bank II (WDBII) data set.
We did some processing of the GSHHS data. We eliminated some slivers along the 180 degree longitude, we edited out some slivers in the Antarctic region, and we used the Repair Geometry geoprocessing tool to delete any features with null geometry. We also created an additional set of feature classes (in the Level1_Processed feature dataset) that includes polygons for both the land and water areas for the Type 1 data (land) (figure 3). We created these by “unioning” the GSHHS polygons with a polygon representing the extent of global coverage (that we created by dissolving the World30 data set on the Esri Data and Maps DVD). The advantage is that you can use this data set to symbolize either land, water, or both.
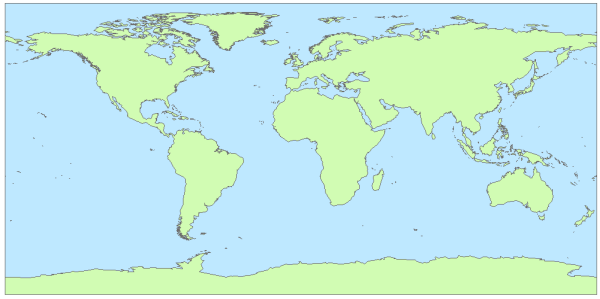
Figure 3. One of the feature classes that includes polygons for both the land and water areas
To help you, we have posted the GSHHS data here so you can download them easily. We also posted for you the data we processed. All these data are in a file geodatabase with six feature datasets, one for each of the five levels of detail. The sixth feature dataset, Level1_Processed, contains the data we processed for all but the most detailed level of GSHHS data. In all, there are 24 feature classes (one empty one, though!) that you can use to make your maps.
Here is a citation you can use if you use the GSHHS data on your map:
Wessel, P., and W. H. F. Smith.1996. A Global, Self-consistent, Hierarchical, High-resolution Shoreline Database. J. GeoPhys. Res., 101(B4: 8741-8743.
Also note that there are datasets for political borders and rivers that you can use with the GSHHS data, derived from World Databank II (WDBII) data which was also used in part to create the GSHHS data. You can download these from the NOAA Web site at: http://www.ngdc.noaa.gov/mgg/shorelines/data/gshhs/version2.1.1/. The rivers and boundaries are in the WDBII_shp_2.1.1.zip file.
Thanks to Aileen Buckley, Mapping Center Lead, for her help with this blog entry!
Article Discussion: