We’re happy to announce that Insights for ArcGIS 3.0 is now available! This release includes many new capabilities that can invigorate your analysis workflows and presentations! These new features are available in both ArcGIS Online and ArcGIS Enterprise. This release of Insights supports ArcGIS Enterprise 10.6.1.
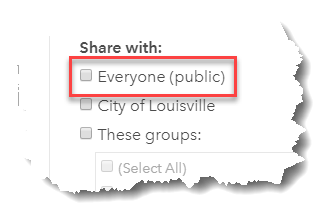
Public Sharing is now available with Insights in ArcGIS Online.
This means that when you share pages, they can be made available to anyone, for example, the citizens of your municipality or your customer base. To view and interact with the shared pages that are made public, a user login or license is not required, anonymous access is just fine.
Have a look at this example live here!
Transform your analysis into interactive data stories.
Notice how the above interactive presentation includes more context and branding to go along with the chart and map cards. Insights now gives you control to use your organization’s colors, logos, and options for communicating your narrative with your shared analysis results. Here are a few specific ways shared presentations have been enhanced:
- Text & Media Widget: Insert titles, text, hyperlinks, images, and videos onto a page.
- Page Color Options: Pages can be customized with background and foreground colors.
- Card Styles: Control the card background and foreground colors, as well as boarder color, width, and line style.
- Chart Axis Labels: Edit the text displaying on chart axes.
- Legend placement: Chart legends and map legends can be placed permanently on the page.
- Themes: Page settings can be saved as a theme, shared, and re-used.
We’ve also added the Predefined Filter widget. This allows you to define a series of filters, name each filter, and then pick between them. Analysts can define these queries with more complexity and logic, but as a viewer you can simply interact with the named filter and see results.
A new KPI (key performance indicator) card is available to you. This chart may show either a number, or a gauge. The gauge allows for evaluating the status of a measure and comparing to a target, min, and max value.
Check out the Predefined Filter widget and KPI card in action. Click the country filter on the left, and see the KPI and map cards update.
Query data without leaving your analysis
Advanced filter expressions now give you more options and control over querying data, with functions and compound filters. This means you have more granular and advanced logic to filter at both the dataset or card level, and show only those records you need.
Explore more relationships in your data
Link analysis (link charts and link maps) were introduced earlier this year. It lets you make sense of associations between people, places, events, and other entities. Insights 3.0 strengthens these relationship modeling capabilities, and takes it to the next level. See this short video of what’s new:
The specific features include the ability to:
- Display three or more node types, and model the multiple relationships between them.
- Use the Eigenvector centrality measure to calculate the influence of a node, based on its connection to other influential nodes.
- Leverage hierarchical and radial layouts have been added. Chart layouts organize your data based on the information you are looking for. This includes the option to set a primary node and collapse/expand nodes.
- Display by Unique Value. Links can now be displayed by unique values using a string field.
- Symbolize nodes with over two dozen new point symbols, and even use custom pictures symbols.
And more…
These are just a few of the exciting new enhancement added with the Insights 3.0 release. There’s lots more, for example we’ve added support for analyzing map image layers that have the feature access capability (this includes map services). We’ve also added support for drawing more features, with improved drawing performance in the map and scatterplot (100k records). Be sure to check out the help documentation for a full list of what’s new.
We especially look forward to seeing what public shared pages you generate, and potentially adding those great examples to our Insights presentation gallery – coming soon! Until then, feel free to share any examples with the Insights GeoNet community.

Commenting is not enabled for this article.