The world is full of data, and maps help you make sense of it. There is a growing need to turn geographic data into compelling maps. People just want to create beautiful, interactive maps and infographics with live data, easily and with confidence. The smart mapping mission is to provide a kind of strong “cartographic artificial intelligence” that enables virtually anyone to visually analyze, create, and share professional- quality maps in just a few minutes, with minimal mapping knowledge or software skills.
 This guide, presented as a story map, explains what smart mapping is, and how to get started using this special capability.
Smart mapping is designed to give ArcGIS users the confidence and ability to quickly make maps that are visually pleasing and effective. Cartographic expertise is “baked” into ArcGIS, meaning it’s part of the fundamental user experience of using ArcGIS. The map results that you see in front of you are driven by the nature of the data itself, the kind of map you want to create, and the kind of story you want to tell.
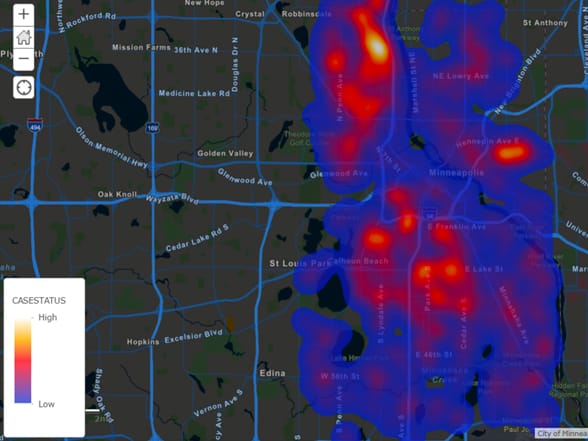 Smart mapping enables you to interact with and interpret the data behind your map. This quick guide introduces a fast, simple way to effectively analyze point data using heat maps within smart mapping.
By taking much of the guesswork out of all the settings and choices that you could conceivably tweak, your initial map results are cartographically appropriate and visually pleasing. You can always change things at will, which you’ll undoubtedly do as you gain more experience, but smart mapping gets you to something effective very quickly. You spend less time iterating and wrangling your maps into fulfilling your intention.
Spatial Data Exploration
One of the critically important capabilities of smart mapping is the added ability to interactively explore your data layers—for example, you can explore the range of values for median household income within each block group in your map by interacting with the histogram of median income values. The ability to interact with the data behind each map layer provides deeper insights into the questions you are trying to answer.
—–
This post is excerpted from The ArcGIS Book, Second Edition: 10 Big Ideas about Applying The Science of Where, by Christian Harder and Clint Brown. The twin goals of this book are to open your eyes to what is now possible with Web GIS, and then spur you into action by putting the technology and deep data resources in your hands. The book is available through Amazon.com and other booksellers, and is also available at TheArcGISBook.com for free.
Commenting is not enabled for this article.