Do you follow the hashtag #mappymeme? Share sightings of #mapsinthewild on social? Would friends and family call out experimenting with John Nelson map styles and layers as your #1 hobby?
Then this year’s ArcGIS StoryMaps Competition may be the one for you.
We launched ArcGIS StoryMaps three years ago, at the Esri User Conference, with a strong foundation but just a few story blocks. With your feedback and innovative storytelling over the years, the product has grown into a powerful data visualization tool with custom themes, growing image gallery options, enhanced interactive blocks, seamless product integration, and much more.
How are you using these tools and your own creative and technical skills to build engaging and impactful stories? We want to know!
For a recap of John Nelson’s invitation to submit a story—without the chickens, spinning, and shed—here are five things you should know about the 2022 ArcGIS StoryMaps Competition.
1. The competition is open to storytellers 18 years old and over.
Whether you’re a data visualization expert, graphic designer, or beginning storyteller, this competition is for you. Storytellers globally, 18 years old and over, are invited to submit a story.
Want to submit an existing story with great data viz? No problem – as long as it’s a story created with ArcGIS StoryMaps. What about a group or team story? Also fine. An applicant is defined as an individual or group submitting one story.
Visit the 2022 ArcGIS StoryMaps Competition website for all the details.

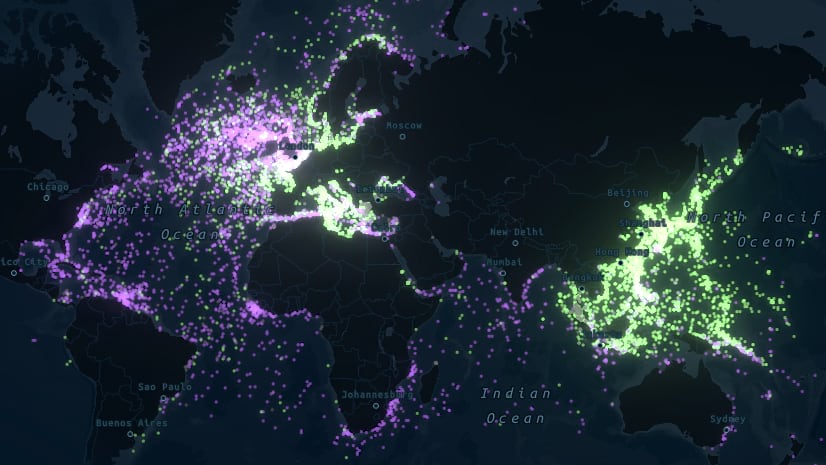
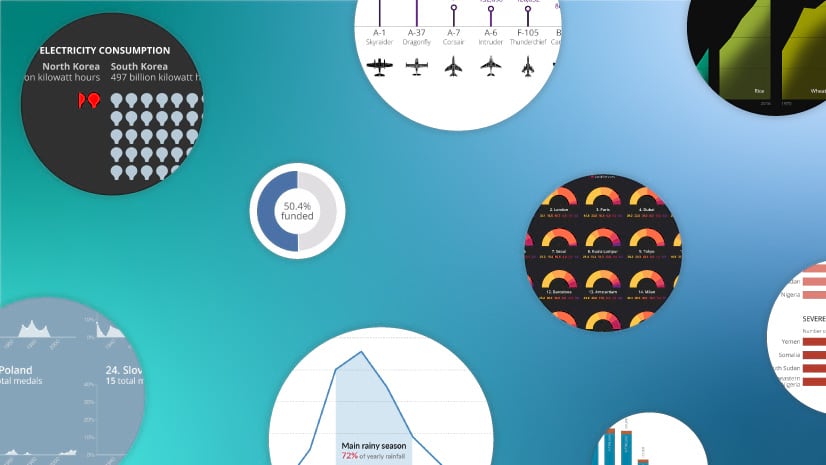
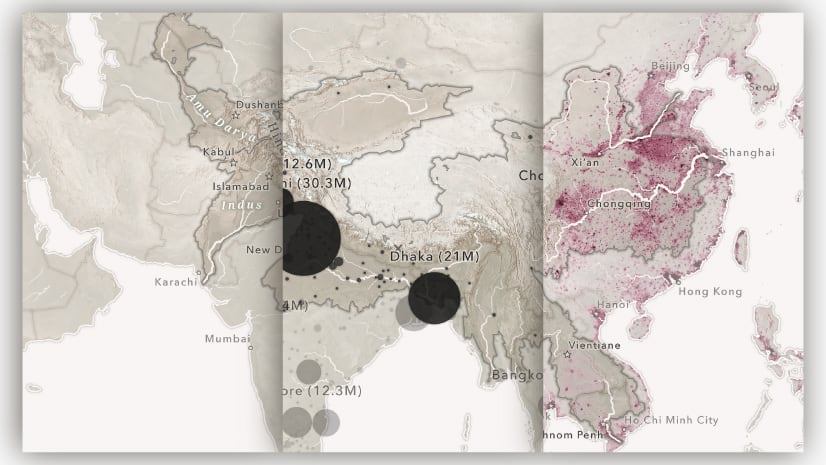
2. It’s all about the data viz.
We’re looking for stories that use data visualization, from maps to charts to custom themes, creatively to communicate an idea, challenge, or solution. Your story might highlight the benefits of mapping the ocean floor or take a look at livestock production around the world.

Whatever your topic and approach, you’ll have five wide-open categories to select from and submit your story.
- Digital humanities and popular culture
- Health and safety
- Humanitarian and social justice
- Nature and physical science
- Planning and infrastructure
Need a few examples? Browse the ArcGIS StoryMaps gallery.
3. Winners receive recognition and a prize.
A guest judge panel will select a winner and runner-up in each category. And as a bonus, the StoryMaps team will recognize a few storytellers who go above and beyond in the areas of cartography, data viz, and design.
All winners will be featured prominently across our digital platforms and receive a free Esri Press book, too. We’ll announce the winners on GIS Day, November 16, 2022.
Take a little time and explore the winners of our 2021 ArcGIS StoryMaps Challenge for Restoring the Ocean.
4. Our guest judges are top-notch.
We’re amazed each year by the diverse talent and collective skill of our guest judging panel. And this year is no exception.
Meet the storytelling and data visualization experts who will be reading your stories!

- LaToya Gray-Sparks, Graduate Student at Virginia Commonwealth University. LaToya is an urban historian; cartographer; and creator of the Randolph Project, which maps communities displaced by urban renewal.
- John Nelson, Cartographer and UX Designer at Esri. John is a mapmaker, software experience designer, and writer for Esri’s ArcGIS Living Atlas of the World team.
- Miriam Olivares, GIS Librarian at Yale University. Miriam leads GIS support services at Yale University. She empowers students and educators to use GIS for creating a better world.
- Joshua Stevens, Lead Visualizer/Cartographer at NASA’s Earth Observatory. Joshua guides the cartographic style, design, and UI/UX for digital storytelling at NASA’s Earth Observatory.
5. We’re excited to share data viz resources.
The StoryMaps team spends a lot of time creating resources—from inspirational stories to tutorials to videos—for the storytelling community. And data visualization builds are, of course, one of our favorites.
Get started with these popular posts:
- Turning a big dataset into a great story with ArcGIS StoryMaps
- Including charts in ArcGIS StoryMaps
- Choreograph your maps with ArcGIS StoryMaps
And then dive deeper into our new Data Visualization Showcase, an ArcGIS StoryMaps collection. Explore stories thoughtfully crafted with different forms of data visualization, and get ideas for your 2022 ArcGIS StoryMaps Competition entry.


Commenting is not enabled for this article.