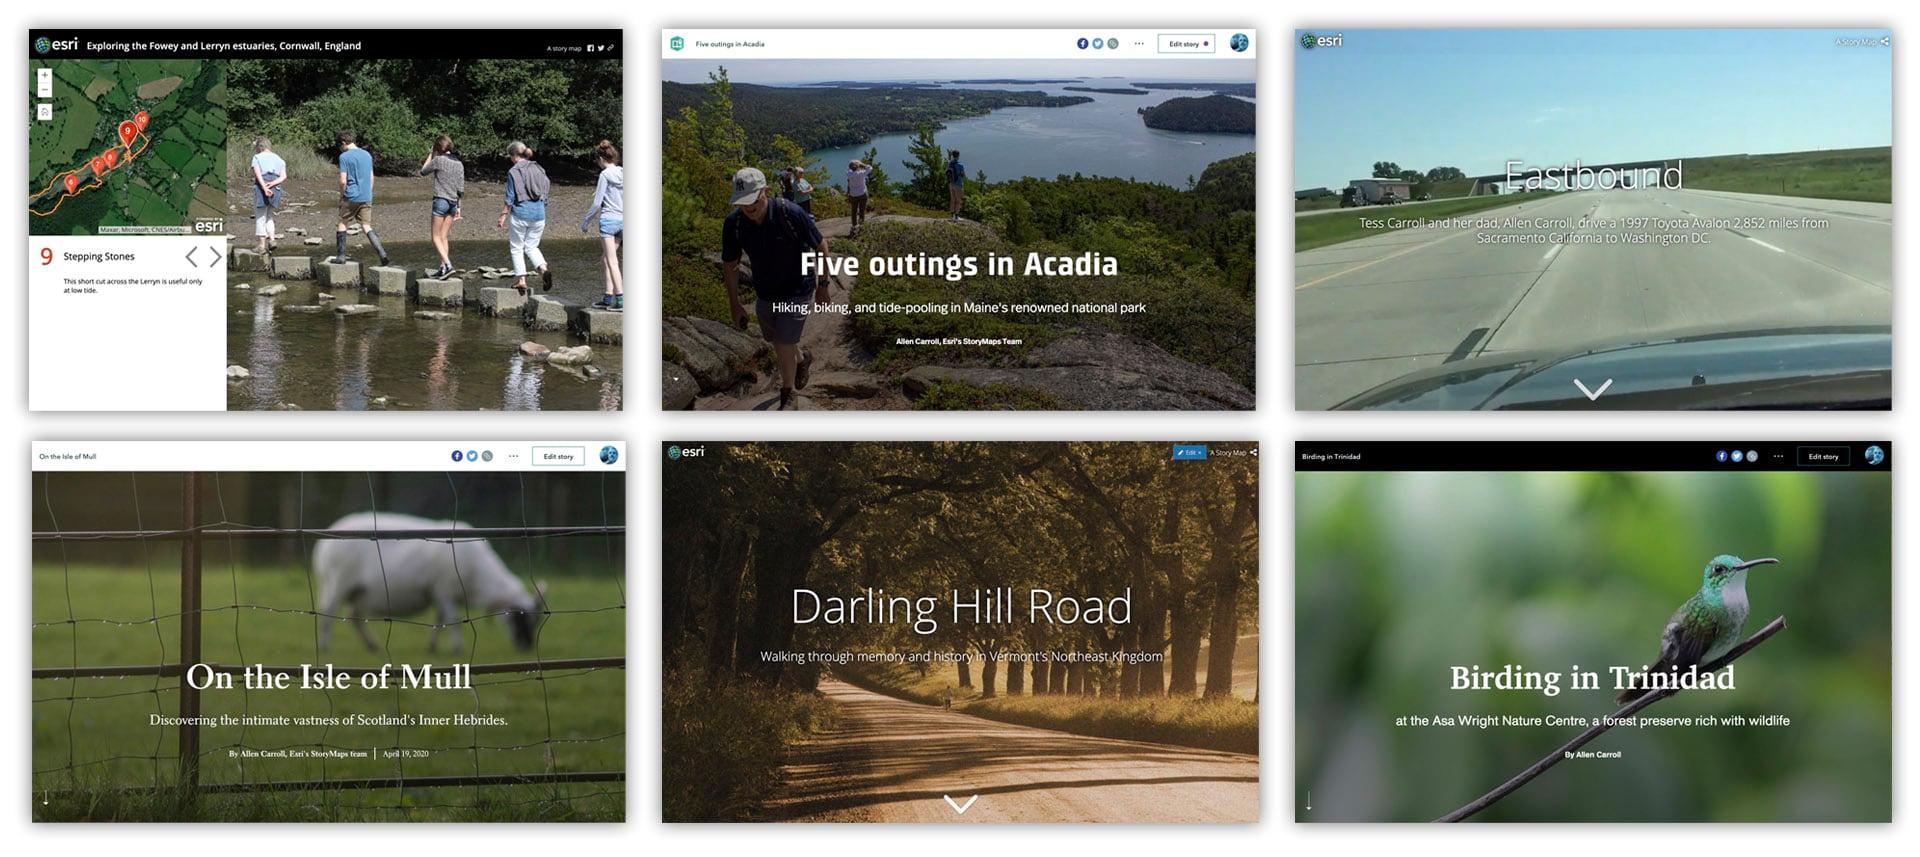
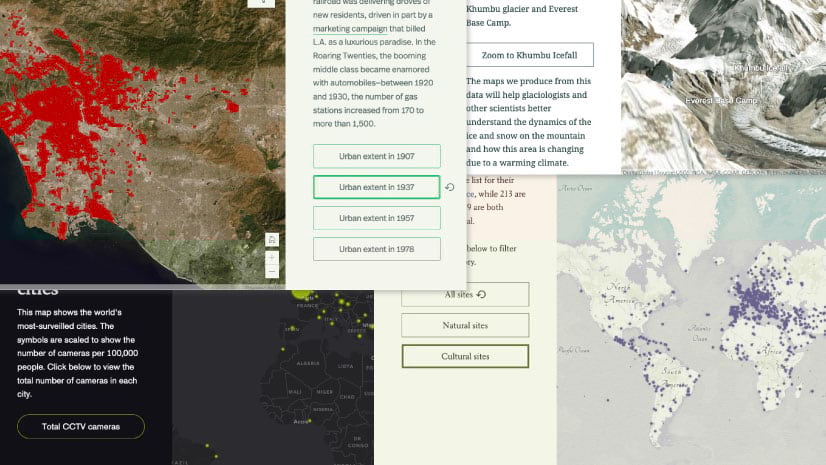
My friends and colleagues know that when I return from a vacation, my fingers itch to open up the ArcGIS StoryMaps builder and put together a travelogue-style narrative documenting my holiday. Over the years I’ve created and shared quite a few, among them Eastbound, Exploring the Fowey and Lerryn Estuaries, Darling Hill Road, On the Isle of Mull, Five Outings in Acadia, Birding in Trinidad…and my latest, Exploring Iowa.
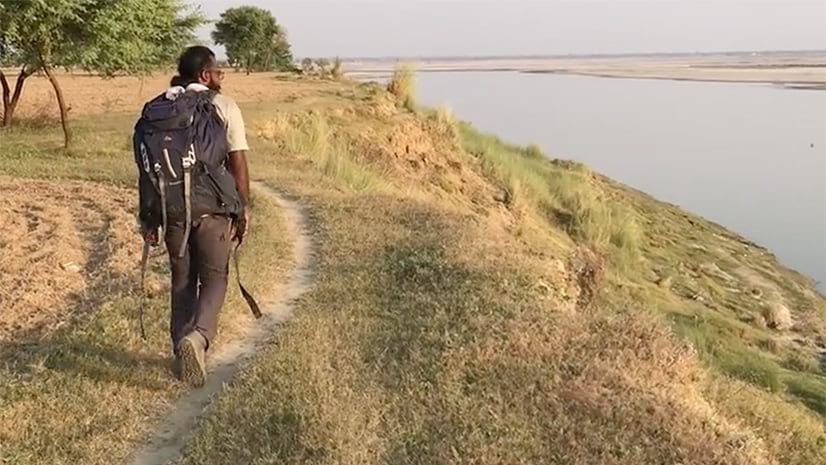
Our plans to return to Scotland’s Isle of Mull in 2020 were, of course, scotched by COVID-19. But our elder daughter’s admission to a master’s program at the Iowa Writers’ Workshop presented an opportunity for a brief adventure in the American Midwest. After getting our daughter settled in a cozy apartment in Iowa City, we rented a car and took off for two days of exploring, taking abundant precautions to maintain social distancing, wear masks, wash hands—you know the drill.
Our hunch that we would enjoy the rolling farmland and small towns of northeast Iowa was more than confirmed. We were astonished and delighted by the sweep and bounty of the great plains and its towns’ gracious, tree-lined neighborhoods and 19th-century storefronts.
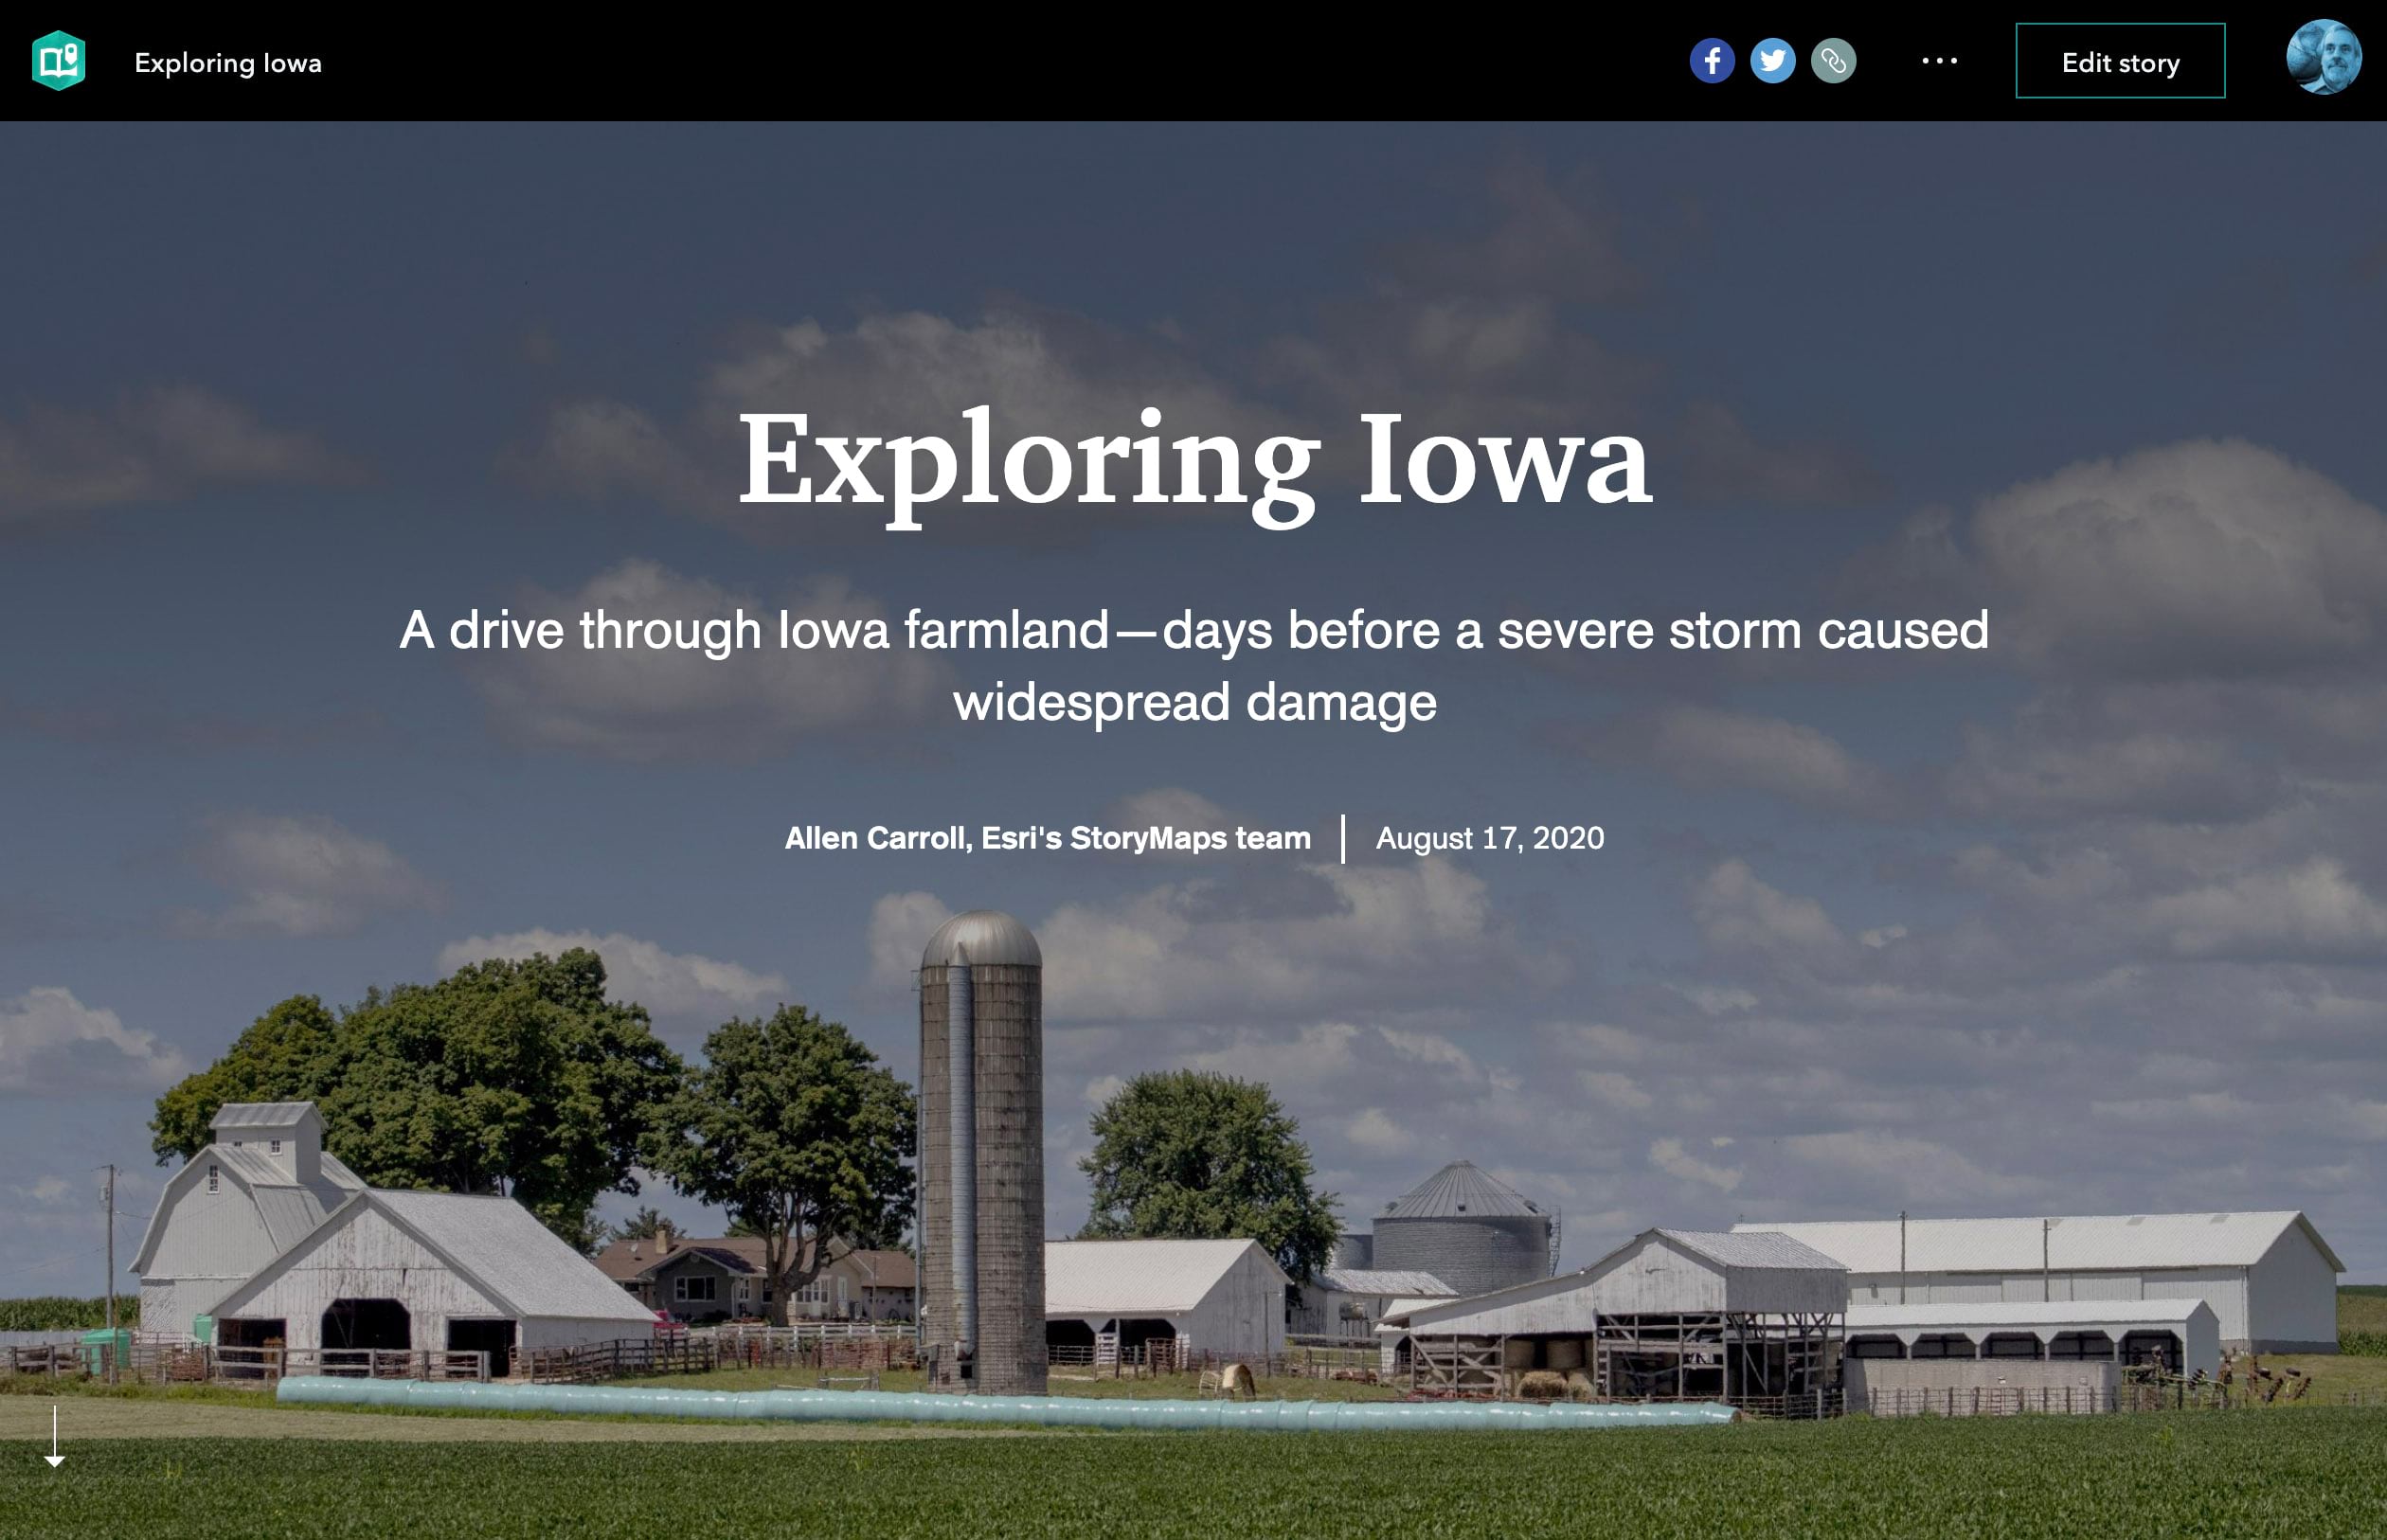
What we never could have anticipated was that, just days after our return, Iowa was struck by a derecho—a severe, fast-moving, wind-driven line of thunderstorms that charged west-to-east across the state, wreaking havoc on cornfields, smashing grain elevators, removing rooftops, and uprooting trees in Cedar Falls, Iowa City, and other towns across the state. Our daughter emerged unscathed after a couple of hours in a storm shelter. But our hearts go out to the farmers, merchants, and residents who now face severe economic hardship during an already-difficult time.
Assembling story and data
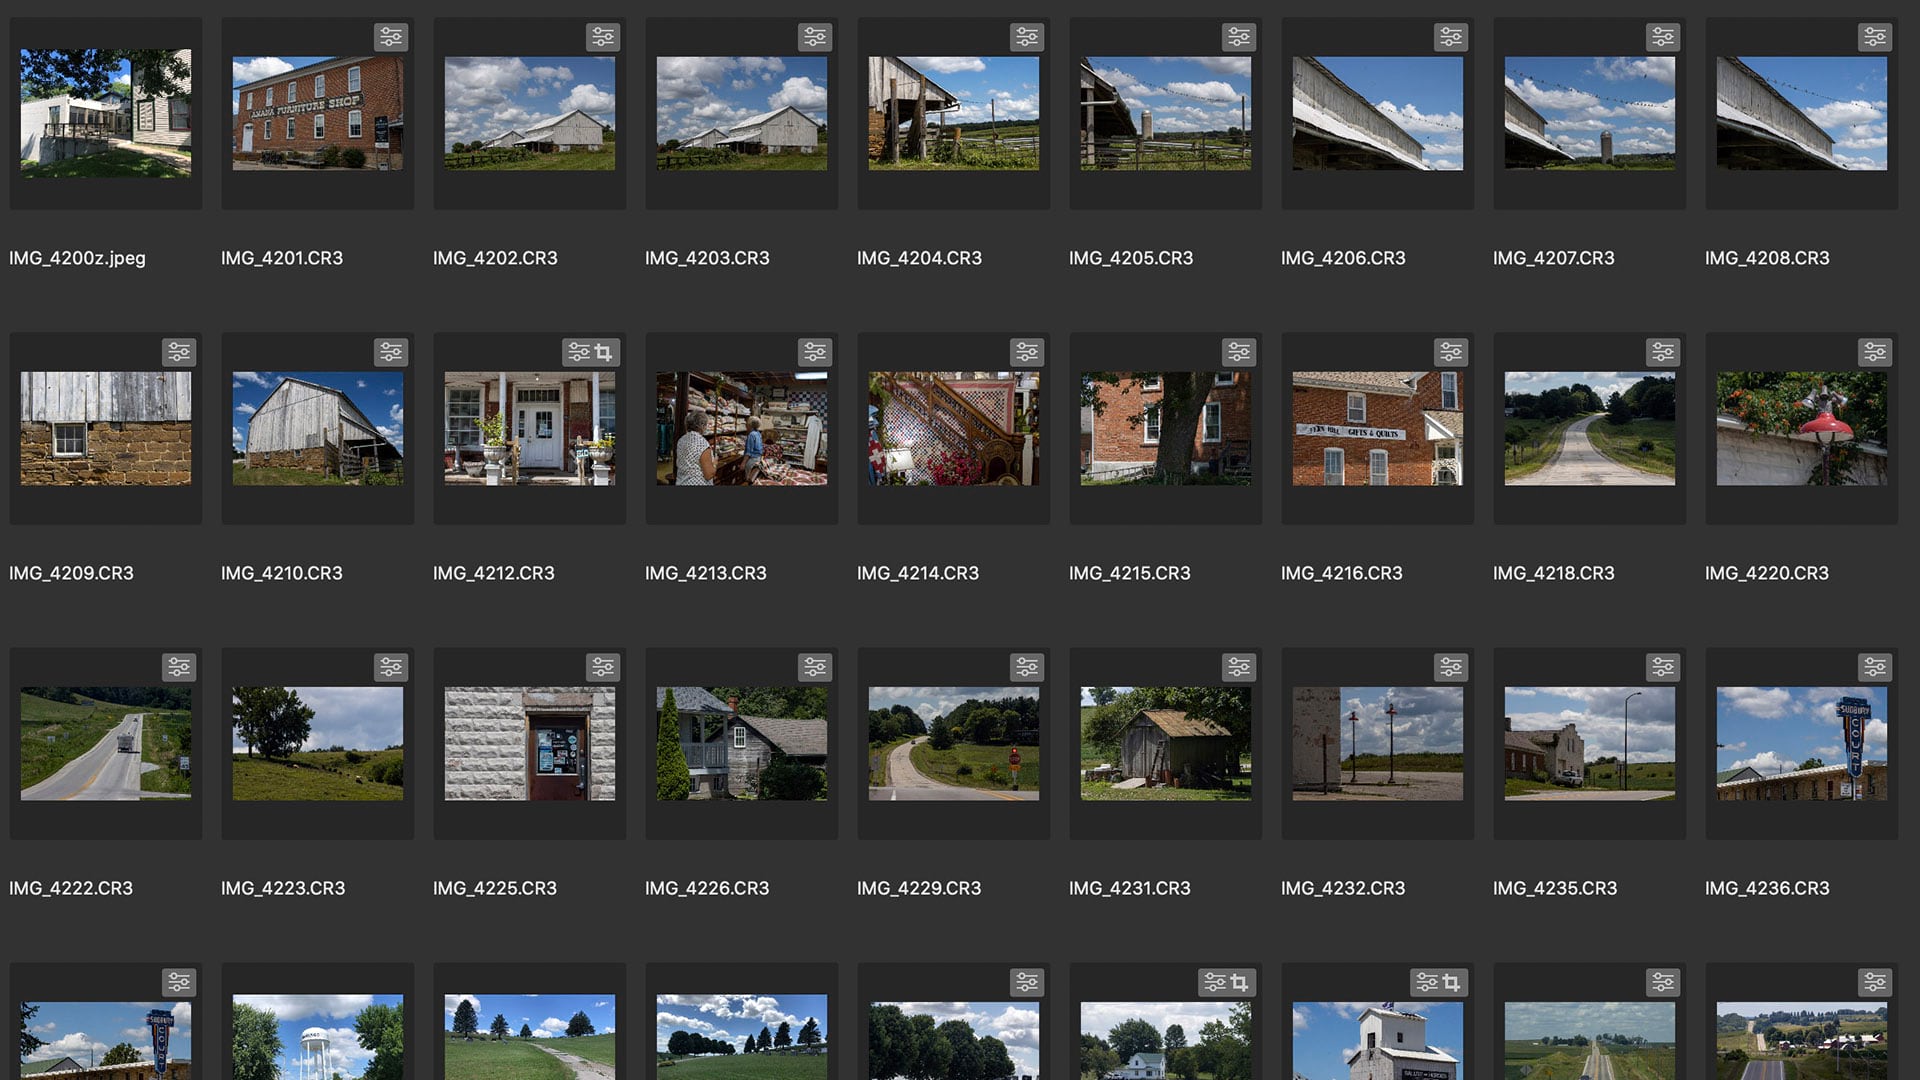
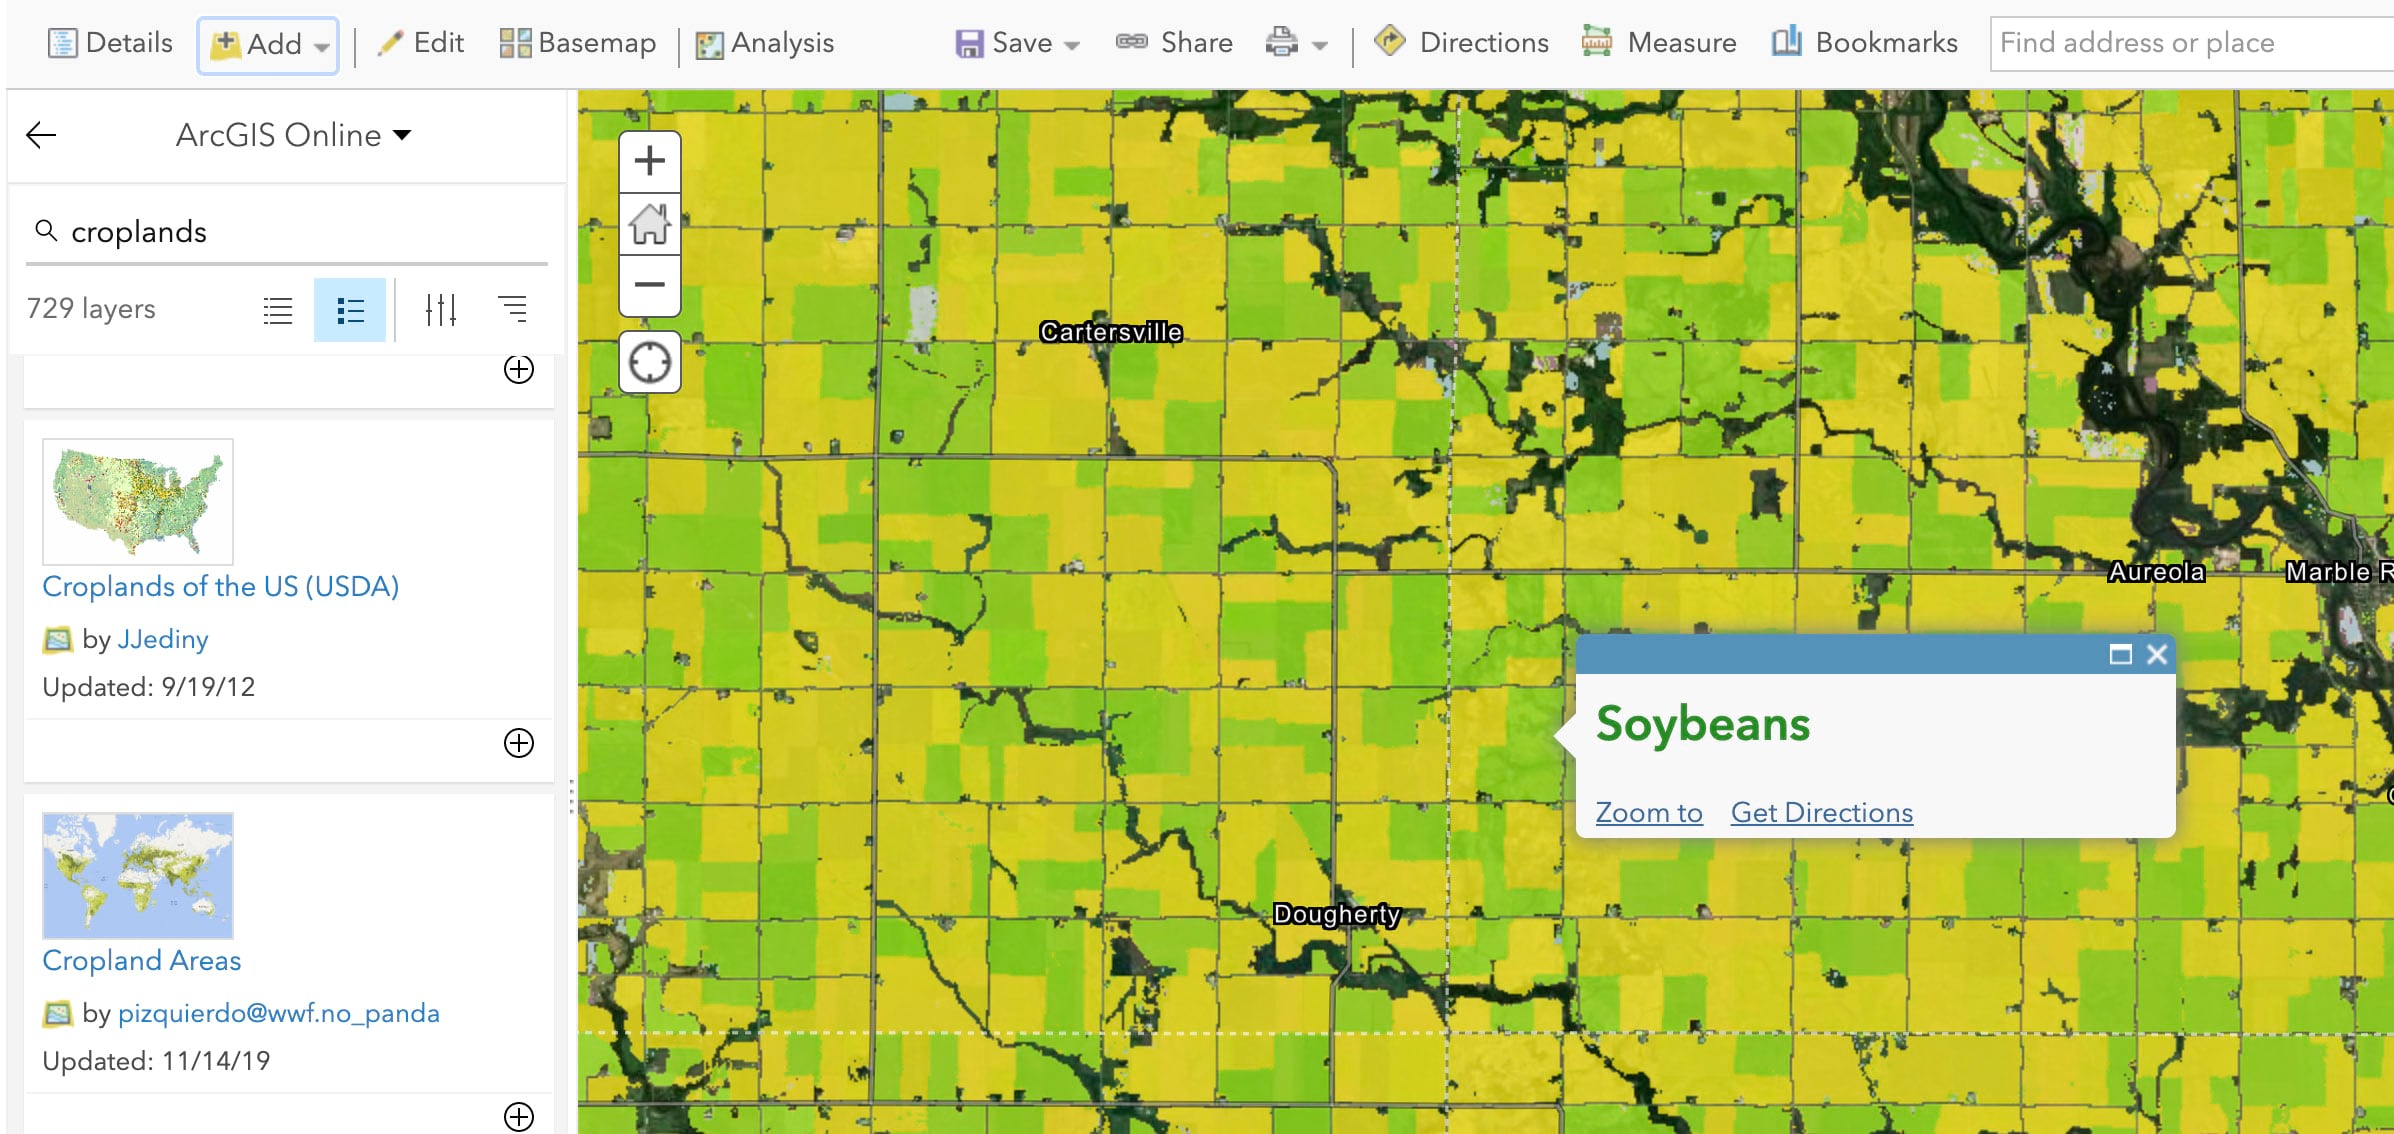
As an amateur photographer, I had amassed ample visuals despite the brevity of our explorations. As I started to assemble the story, I began to search ArcGIS Online for spatial data related to some of the sights we saw. Wanting to illustrate the prevalence of corn and soybeans, I searched and found the wonderful USA Croplands dataset on Esri’s Living Atlas of the World, showing year-by-year the crops grown in every field in the country. That whetted my appetite for more.
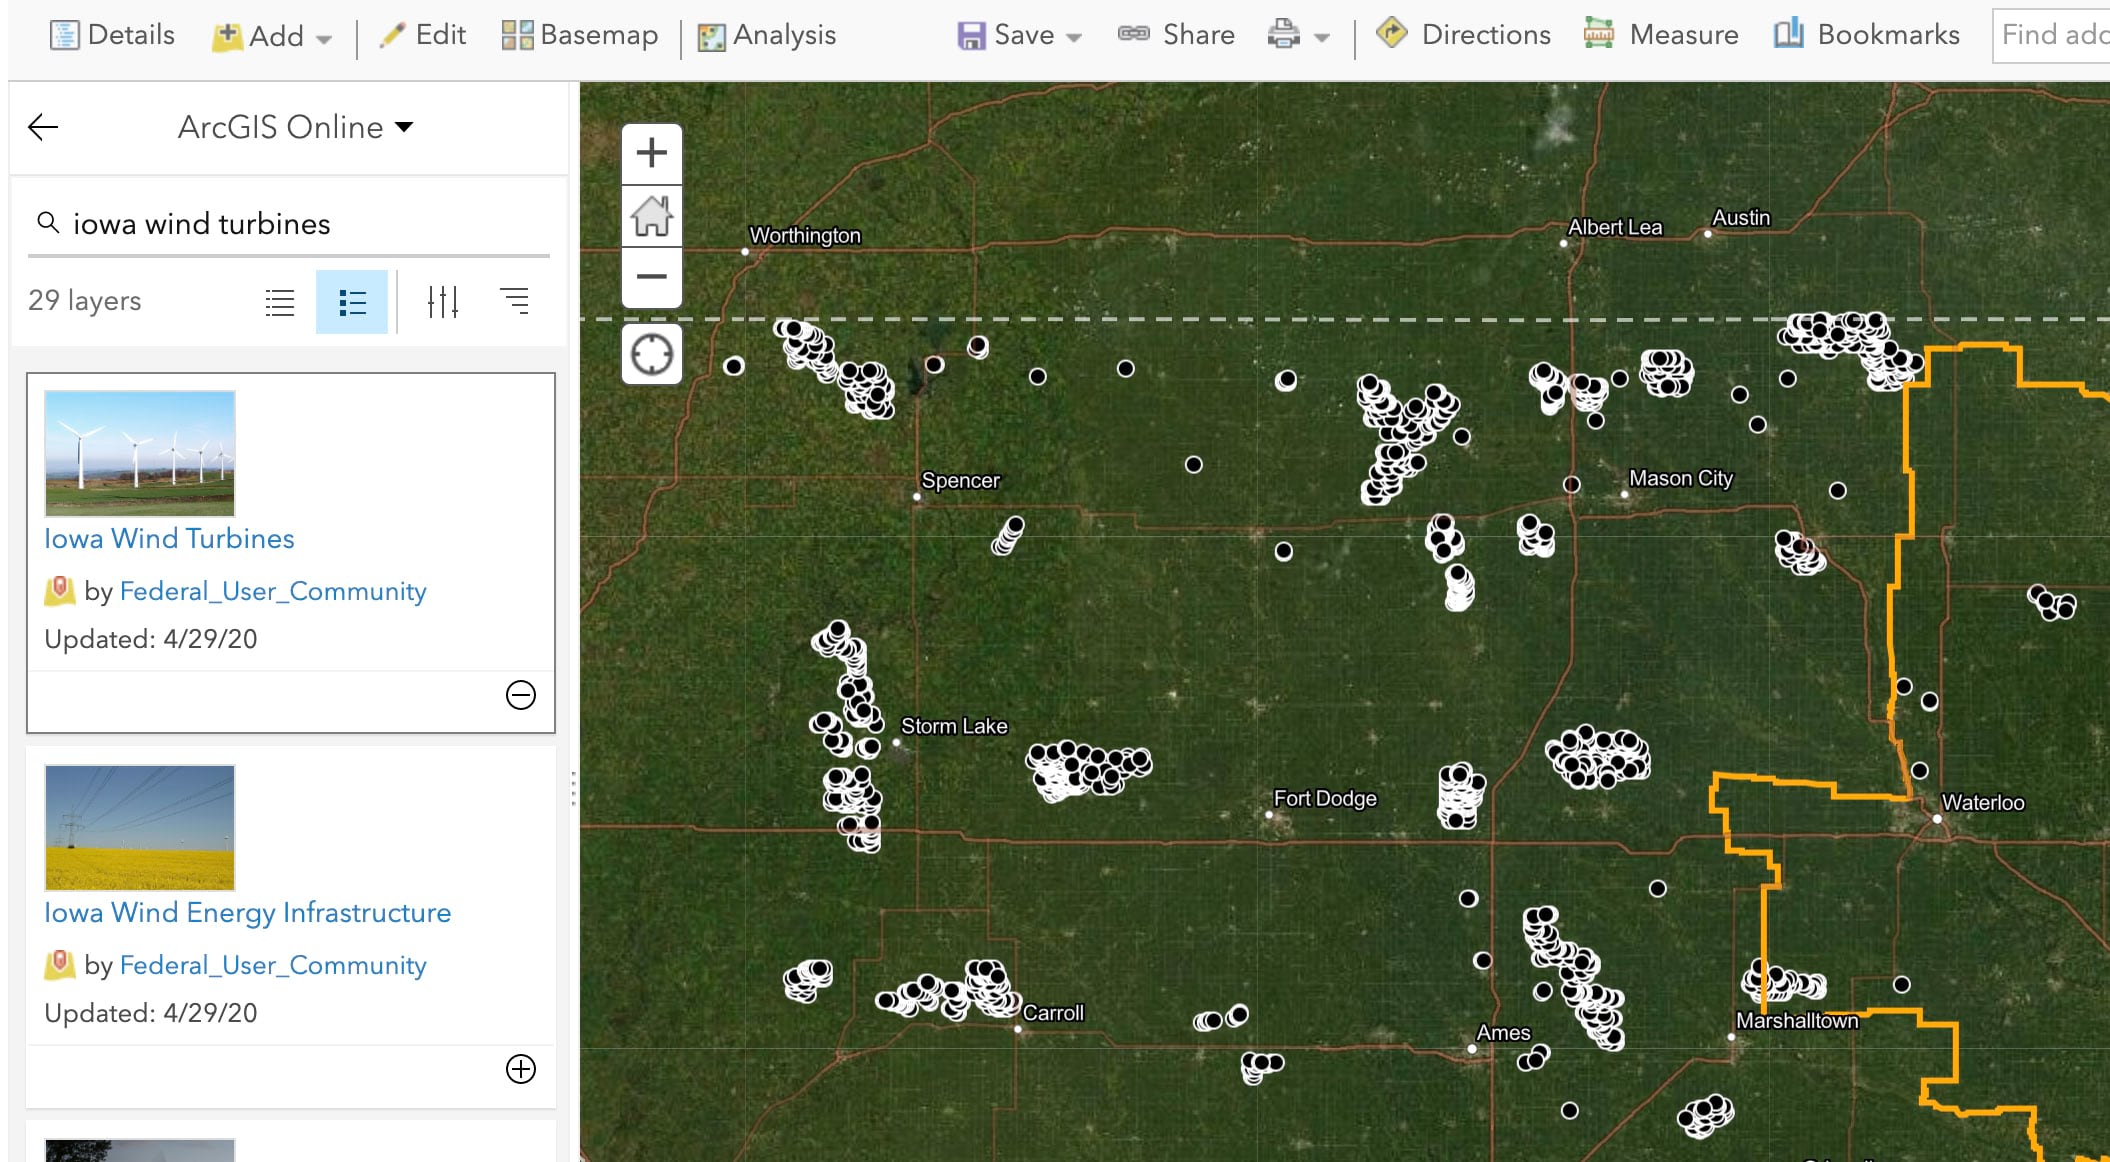
Was there data on location of Iowa grain elevators? Not quite, but Iowa’s DOT had published a layer showing all grain elevators adjacent to railroads. I had taken pictures of towering wind turbines. Was there a map of every wind turbine in Iowa? Yes! We had a memorable picnic lunch at a tiny rural graveyard. Could I include a map of every cemetery in the state of Iowa? Of course. We stopped for a stroll at two county seats. Could I depict county boundaries? Again, yes.
To feature this data within my story, I put all of them into a single web map, along with our route (hand drawn, which was tedious but kind of fun) and landmarks (again added manually). I saved the map with the layers not visible, simply to save time in the builder: Instead of having to toggle off most layers for each stop as I built my tour, I needed only to toggle on the layers I wanted to feature.
I also needed to change the visual styles for some of the layers (compare the wind turbines data below with how it appears in my story), and I CONFIGURED POPUPS to eliminate superfluous information and make them read well. Why did I add the emphasis to my mention of popups? Because we find that unconfigured popups are the achilles heel—a key missing refinement—of countless stories. Please configure your web map popups!
It would have been logical to choose ArcGIS StoryMaps’ guided tour immersive to tell my story. Although you can now use a web map within a guided tour, you can’t yet expose or hide layers of the web map for individual tour stops. So instead I chose sidecar’s floating panel layout, and opted for the widest panel setting to best feature my photos.
I used the imagery basemap, and wanted to show how several of the tour stops look from above. That required setting the zoom levels quite close-in. When I shared a draft story with my team, they griped that the story didn’t effectively keep them oriented. In response I made a few static maps of our tour route, from screen grabs of my web map, to include, where appropriate, in the floating panels.
The upshot
What’s the moral of this story? To me it’s the ability of spatial data to enrich a narrative.
For instance, I featured in the Iowa story a picture of a wind turbine. That might be mildly interesting, but to use that image as a springboard to a map that shows that Iowa has more than 3,000 turbines scattered across the northern and western parts of the state enriches the story and hints at a major shift toward renewable energy. A picture of a grain elevator is okay, but to then see how grain elevators trace the historical rail lines criss-crossing the state provides a surprising insight.
I often talk about microcosm and macrocosm in storytelling. In this case, our tour of Iowa is the microcosm, and the thematic maps in the story link our anecdotal experience to larger realms of meaning—the macrocosm. That’s really what good storytelling is about, and why stories are so vital to how we as humans learn about, and relish, the abundant treasures of our world.

Article Discussion: