
About the author: Robert Rose is the Director of the Center for Geospatial Analysis at the College of William & Mary. He comes to William & Mary after seven years at the Wildlife Conservation Society as the Assistant Director of Conservation Support, a team that provided technical support and training to conservation programs around the globe. Robert’s interests include the use of GIS and remote sensing to better understand drivers of land change and broader conservation issues, the promotion of remote sensing for conservation applications and the integration of advanced and interactive geovisualization tools to better engage students in the classroom. Robert earned a PhD in Geography with a minor in ecology from the University of Wisconsin-Madison.
The Center for Geospatial Analysis at William & Mary (CGA), as a non-departmental campus support unit, has a mission of providing high-quality geospatial education to students across all disciplines on campus. Not being tied to a specific department affords us the opportunity and flexibility to find innovative and creative ways to teach GIS at both the introductory and advanced levels. This semester, after developing a geographic information system (GIS) of Middle Earth, I introduced a GIS & Middle Earth course into our curriculum.
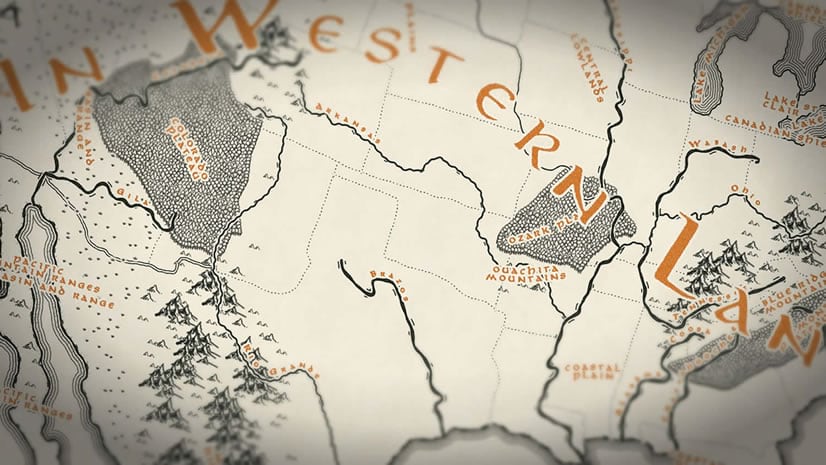
The motivation for developing a GIS of Middle Earth – and subsequently a GIS and Middle Earth course – really grew out of a love for the original books and the Peter Jackson series of movies. As a tradition, my family and I typically watch the movies from start to finish once a year. During a recent viewing I started to wonder if Frodo took the best path from the Shire to Middle Earth and it dawned on me that, with the right GIS layers, we could run a least cost path analysis to see if there could have been a better route. This idea launched an effort to build a GIS of Middle Earth. Three years later, we have an extensive list of layers, including a 50 meter elevation model, roads, rivers, realms and many others. With the GIS built, I felt it was time to put the analysis in the hands of students, adding GIS & Middle Earth to our curriculum.

The goal of this project-based, advanced GIS course was to answer the question: did Frodo take the right path to destroy the One Ring? This goal could be broken down into two objectives: First, to build skills and confidence in the students’ abilities to answer questions using spatial data. Through readings, discussions, lab work, and long-term projects, students gained a deeper understanding of the tools and techniques for spatial analysis. Second, students were challenged to apply their GIS experience to identify the best path from the Shire to Mount Doom.
Creating the necessary layers
Students worked in teams of three or four to develop the cost layer needed to run the least cost path analysis. Each team was required to develop a minimum of three threat layers and three cost of travel layers that were combined, using a weighted sum analysis, into the final cost layer. Example threat layers included proximity to orcs, danger level in different realms, and—my favorite—likelihood of being seen by Sauron based on a viewshed analysis. Cost to travel layers included the slope and ruggedness of the terrain, ease of travel across different land cover types and width of rivers based on derived stream order.

Along with the team work to develop the cost layer, I introduced advanced GIS topics that I thought might aid their analysis. These included the viewshed analysis tool, zonal statistics and the summed Point Influence tool (SPI). For those not familiar, SPI was originally developed by Kim Fisher (of Wildlife Conservation Society) and Karl Didier (of Rainforest Trust) to model the impact of hunters on natural areas. In addition, each student was required to present a tool of the day, where they introduced one new tool from the ArcToolbox and explain how it might be useful in their analysis.
Calculating and communicating the final results
With the cost layer developed, teams then calculated the least cost path between the Shire and Mount Doom. They were allowed to throw the story narrative away and compute the best path directly between the two locations, or they could use parts of the original story to drive their final analysis. For instance, one team decided it was important for Frodo to go from the Shire to Rivendell in order to meet other companions and restock on supplies.

The final step for each team was to develop a story map describing their analysis. We have been using Esri Story Maps for final presentations in many of our classes for a number of reasons. First, we want students to learn how to develop story maps as a better way to share their place-based research. Second, story map templates, especially Story Map Cascade, allow students to be more creative in their final presentations and, frankly, students find them more fun to develop when compared to standard presentation tools. Finally, for this class, I wanted students to embrace the idea of telling a story, since the whole analysis was derived from wonderful storytelling by Tolkien. To that effect, I set a minimum amount of requirements and instructed the students to embrace the idea of telling the story of their research—the results did not disappoint:
The four story maps developed highlight both the GIS analysis and the creativity William & Mary students typically bring to project-based GIS courses. Not only do they show off really great GIS analyses, they also include images, videos, stylized fonts and advanced mapping techniques to engage the reader in their story. One team went as far as retelling the story of Frodo’s journey to Mount Doom to destroy the One Ring.

In launching this course, I had hoped to find a few students would be excited about expanding their GIS skills while exploring the world of Middle Earth. I was not disappointed. Comments from the course evaluation included: “This was a very fun class, and a great opportunity to be creative while learning and honing practical GIS skills” and “I would take this class again because not only did I build my GIS skills but I also was able to build my team skills and enjoyed this thoroughly.”
At the CGA, we are constantly searching for new ways to get students excited about learning GIS and believe this course, and other project-based courses following a similar format do just that. We hope to continue to expand our curriculum and look for new was to engage our advanced GIS students.

Article Discussion: