The 2018 Esri User Conference was an amazing opportunity to demonstrate the capabilities of the new network management solution across the ArcGIS Enterprise 10.6.1 platform using ArcGIS Pro 2.2 and the utility network. One of the most popular new features is the ability to see the network using archiving and historical moments.
For example, utilities need to prepare compliance reporting based upon operational expenditures and forecast budgets for scheduled maintenance. Traditionally, these estimates are based upon database metrics such as the total number of poles, miles of conductor, and even reliability issues over the past year.
The utility network is built on top of a new multi-user editing versioning model that is stateless, serviced based, more performant and supports historical records out of the box. Versioning has been in the Esri ecosystem for a long time as a way to provide high-isolation editing experience, reconcile and resolve conflicts between versions and posting quality assured work into the production Default version.
With historical moments, we can now analyze circuits to determine if there are differences in predictive maintenance costs based upon changes in network configuration or even new construction.
The new versioning model allows users to always keep track of every edit that was made in the system. This is critical for utility companies to track changes in assets, load and growing number of customers making GIS the system of records. Keeping in mind that this is based on transaction time when the edits happened in the GIS not when the maintenance work order has been carried. Learn more about the new versioning model (Branch versioning) by clicking here.
In this article, we will discuss how the utility network benefits from the historical transactions to answer interesting questions.
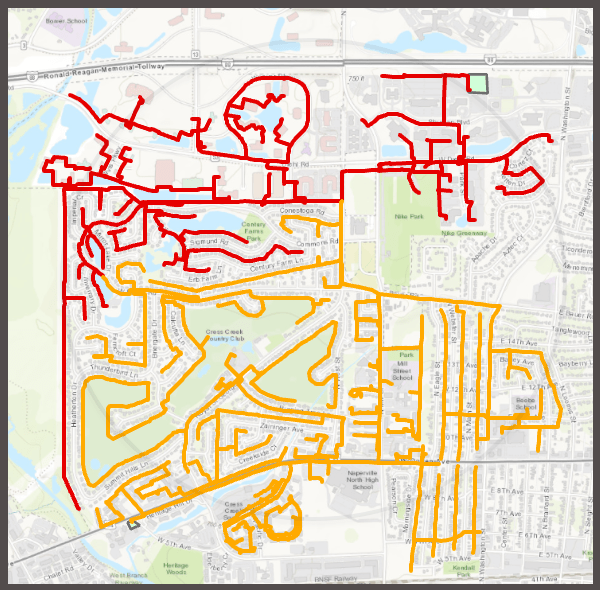
The image below is a utility network of the city of Naperville electric distribution. The top layer is a subtype group layer of the subnetwork line class which represents the circuits in the network with summaries of each circuit such as customer count, load, and other information. The red distribution circuit (RMT003) and the orange distribution circuit (RMT001). Click here to learn more about subnetwork summaries. We can examine how load growth has impacted these subnetworks, possibly due to a hotter than normal summer or strains on local circuits due to new developments or changes in industrial load growth.
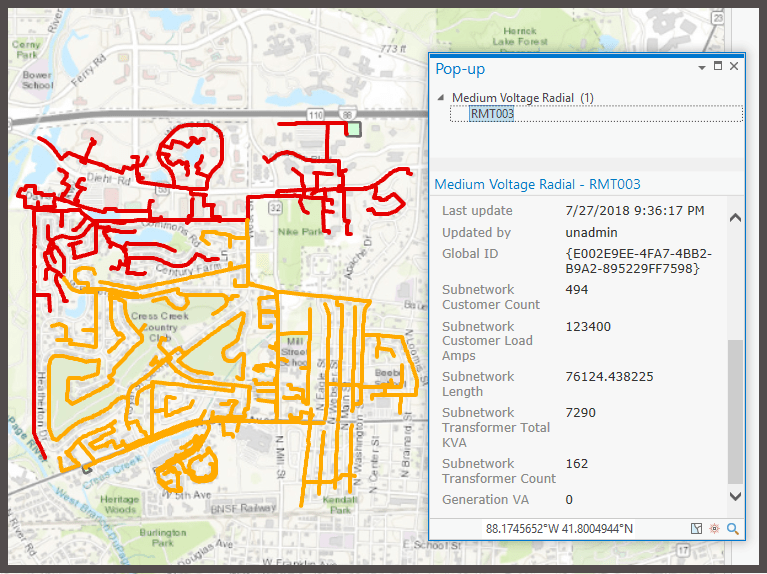
The subnetline features are part of the subnetwork management capability in the utility network. Subnetlines are generated as a result of running Update Subnetworks geoprocessing tool. This tool runs a trace on the specified tier, writes to the subnetwork name field and updates the summaries of the subnetline feature. When we identify the subnetline feature for the RMT003 circuit/subnetwork (shown in red) we can see the summary attributes for the current network state. The total number of customers on this circuit (Subnetwork Customer Count), total load (Subnetwork Customer Load Amps), and the length of the circuit (Subnetwork length). Note that we currently have 494 customers on the red circuit RMT003.
Everything looks good.
But it wasn’t always like this. Earlier that day, our engineers noted that the RMT003 was being underutilized in terms of the number of customers using the available load. They performed a planned switching job over the two circuits to balance the load. Our job as an analyst is to examine the changes to the circuit over time in terms of assets and load, and provide metrics to accounting to balance available load to improve reliability and reduce customer costs.
To see how our engineers made that decision, we will need to go back in time before the switching job occurred to see changes in load and number of customers. Here is how we do using ArcGIS Pro.
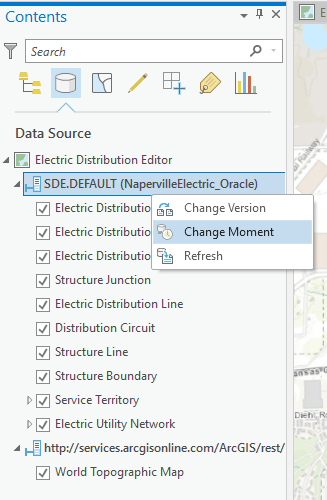
First, ensure within the Contents pane List by data source is selected.
From the Data Source tab, right click on the SDE.DEFAULT version and select Change Moment.
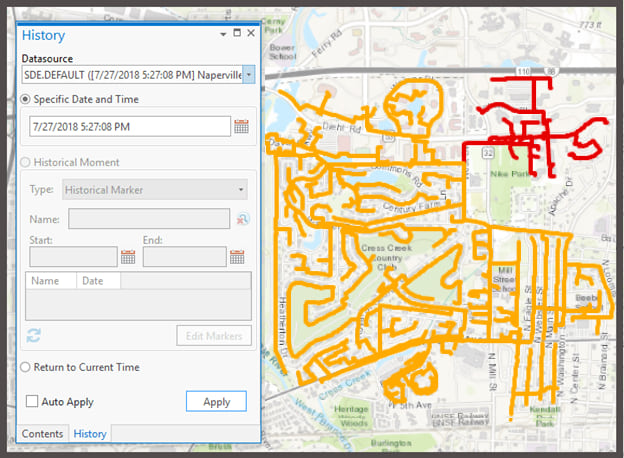
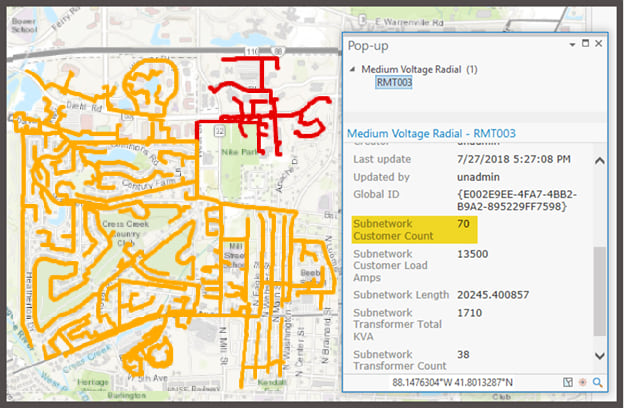
We will be presented with the History pane, which will allow us to change the moment of the currently active workspace to point to a specific date and time. Let’s plug in the date and time of the transaction in GIS 7/27/2018 5:27:08 PM before we added customers to the circuit and hit apply. After a few seconds, we notice the project is now pointing to the moment in the past and the map view changes to reflect that moment. Notice that red circuit RMT003 were underutilized and the orange circuit RMT001 was slightly overloaded as illustrated in the image below.
Let’s compare the number of customers on circuit RMT003; Notice that the number of customers that were active on the circuit when we went back in time were only 70, but we could easily increase the load to 424 customers by taking some of the customers from RMT001. Based upon the circuit load, we could see the impact of transferring the customers and balancing load across the network. Having this historical data enables maintenance and reliability teams to be proactive in their work forecasting and provide reliable power to our customer base.
In summary, by combining the power of the utility network and the archiving capability of the new versioning model we can view and answer questions pertaining to reliability and balance our customer load using the core ArcGIS Platform. Another thing to mention is we can build a custom web app today that perform the same tasks that we just did in Pro and that is possible because the new versioning model is a services based model.
Comment down below if you would like to see more blog posts about the new versioning model and utility network!
UPDATE: 10/6/2018
I have been getting some emails with very good questions regarding how to implement this through the web. I’m planning to write another blog post about that but meanwhile here is a summary of how it possible.
After performing any edit through a feature service that supports version management capability, the server responds with a “moment”. This moment is the new timestamp that the version being edited is currently pointing to after that edit. The edit could range from a simple feature creation to a complex update subnetwork. Regardless, it is just a moment in time. Query operations through feature service that supports version management capability can take a “moment” as an input. This allows you to run the query at that moment. All utility network query methods like Trace also supports taking a moment. So you can run a trace in a specific moment, regardless of how far back that moment is in time. You can store these moments in the client then call the necessary methods by passing the moment. Thus achieving tracing in the past.
Now those moments are not guaranteed to be consistent, you could have dirty areas which will cause the trace to return incorrect results. That is why the utility network exposes a method called QueryNetworkMoments can give you a consistent moment like when was the last time a full validate was run.

Article Discussion: