Introduction
The pace at which utility companies operate has change dramatically over the past 15 years, moving away from paper and striving for completely electronic workflow. One of the most important steps towards implementing electronic workflows at a utility is to implement Esri’s ArcGIS Utility Network. GIS is at the core of many of these workflows and the utility network provides a platform that allows for the digital exchange of very complex datasets between major functional areas of a utility: Construction Design, Operations, Customer Care, and Planning.
In this blog I will demonstrate how the ArcGIS Utility Network enables one of the most essential workflows to an electrical utility: the lifecycle and management of features all the way from the design process to the outage management system. The networks described in this solution is completely out of the box, using proposed features, trace configurations, and tie points to manage the construction management lifecycle. This means that any electric utility implementing the utility network, no matter how large or how small, can implement this workflow with little to no additional impact to the GIS. Assuming the OMS you are implementing has been certified as compatible with the Utility Network you can focus on working with your OMS vendor, or a business partner, to update your interfaces between the GIS and the OMS
Workflow Overview
Individual workflows can vary for significantly for different types of construction. To simplify this discussion, the approach below focuses exclusively on the pieces of the workflow that interact with the GIS.

Design
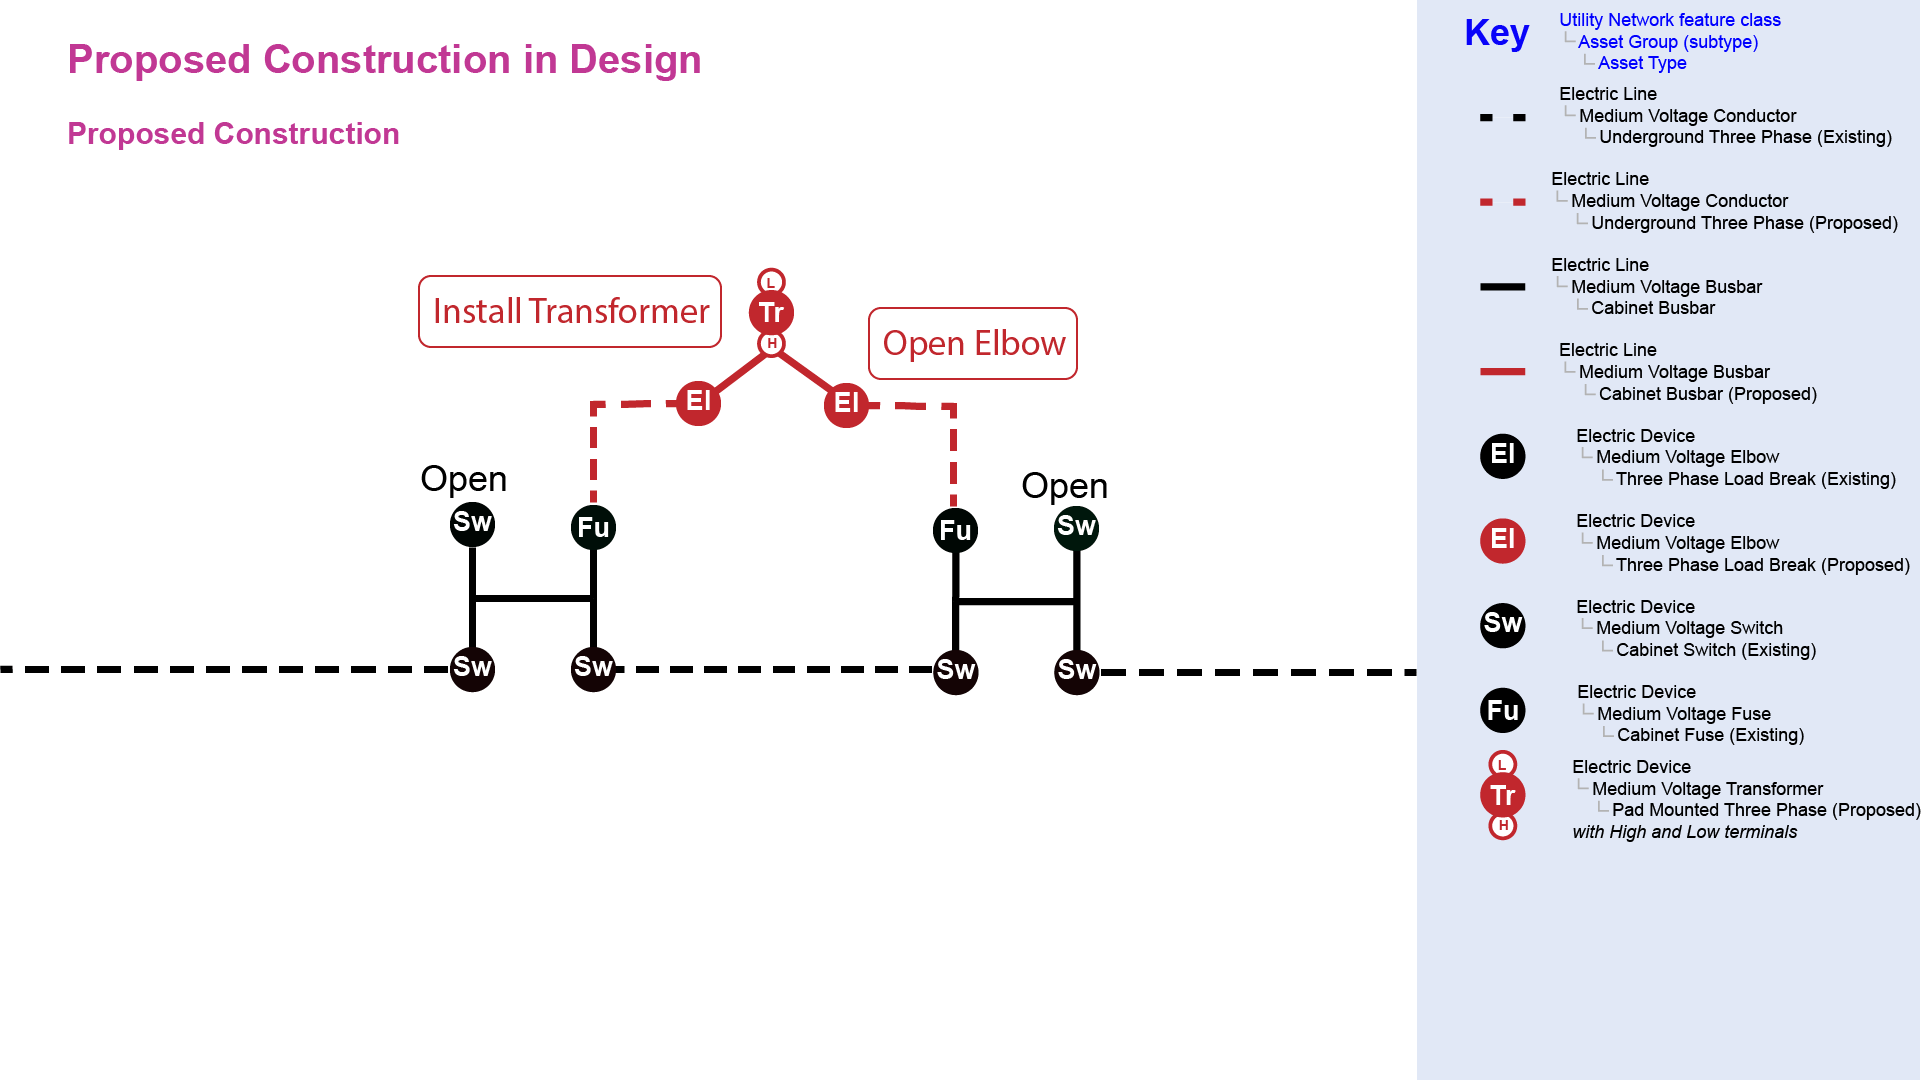
A designer starts their design by importing the current state of the network for their area of interest from the GIS. The designer then uses the design tool to call out materials to be installed or retired that satisfy the requirements of their project. Once the job receives all its engineering and financial approvals the job is scheduled for construction. At this point, the details of the job are electronically transmitted from the design back into the GIS. Planned removal features continue to participate in the network until construction occurs and the features are retired or abandoned. New construction initially appears de-energized, but as features are energized in the field the GIS is updated to reflect the as-builts.
Operations
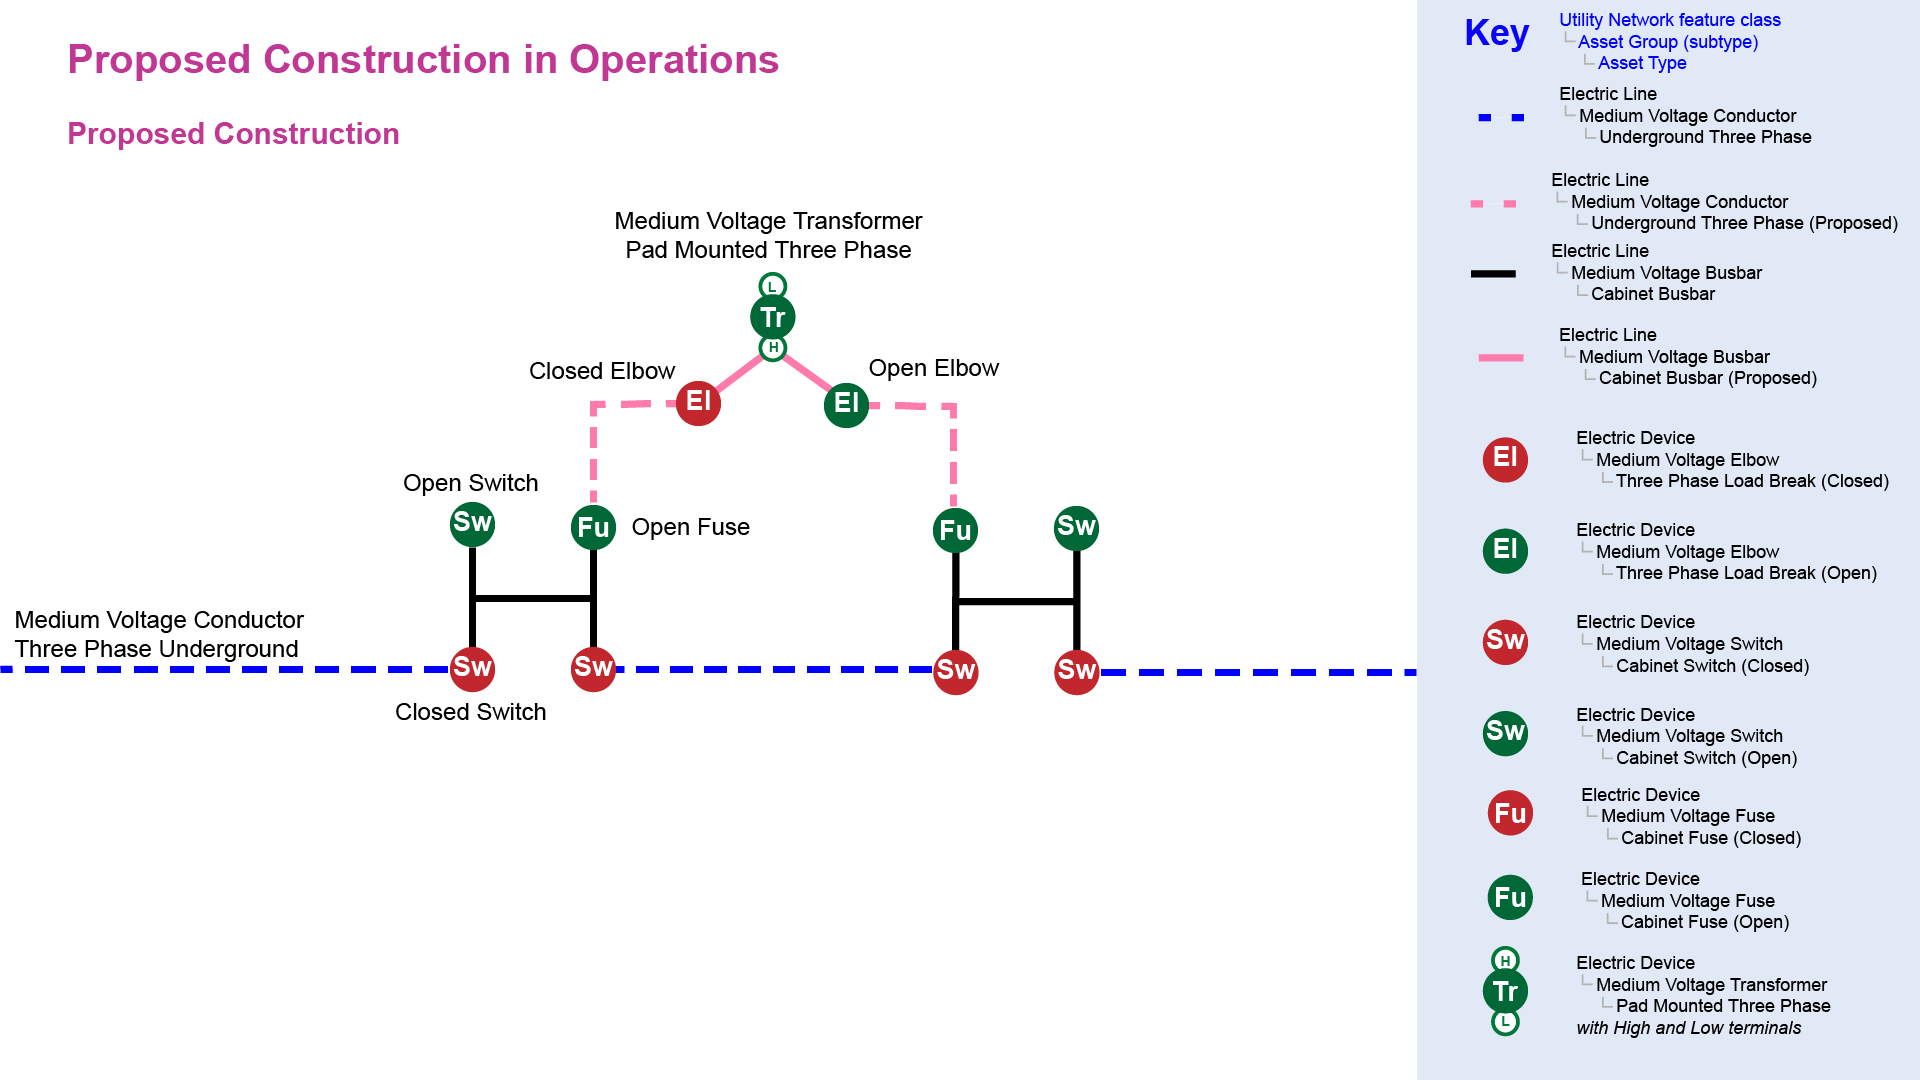
As proposed, de-energized features are added to the network the GIS the corresponding networks will be marked as dirty and/or changed. Other systems can query the GIS for circuits that have changed recently, or have changed since the last time a circuit was extracted. This is a convenient way for customers with larger networks to perform incremental network extracts.
Proposed features appear in a de-energized state in the OMS so dispatchers are aware of the proposed construction and can develop switch orders that will allow crews to safely energize the area as features are being constructed. As features are constructed, operations will coordinate switching orders with field crews to ensure the OMS reflects what is in the field. Once the GIS receives the as-builts for the work performed they make any material adjustments to the corresponding features. This will turn the features from being in a proposed, de-energized state to being in service and energized.
Proposed Features
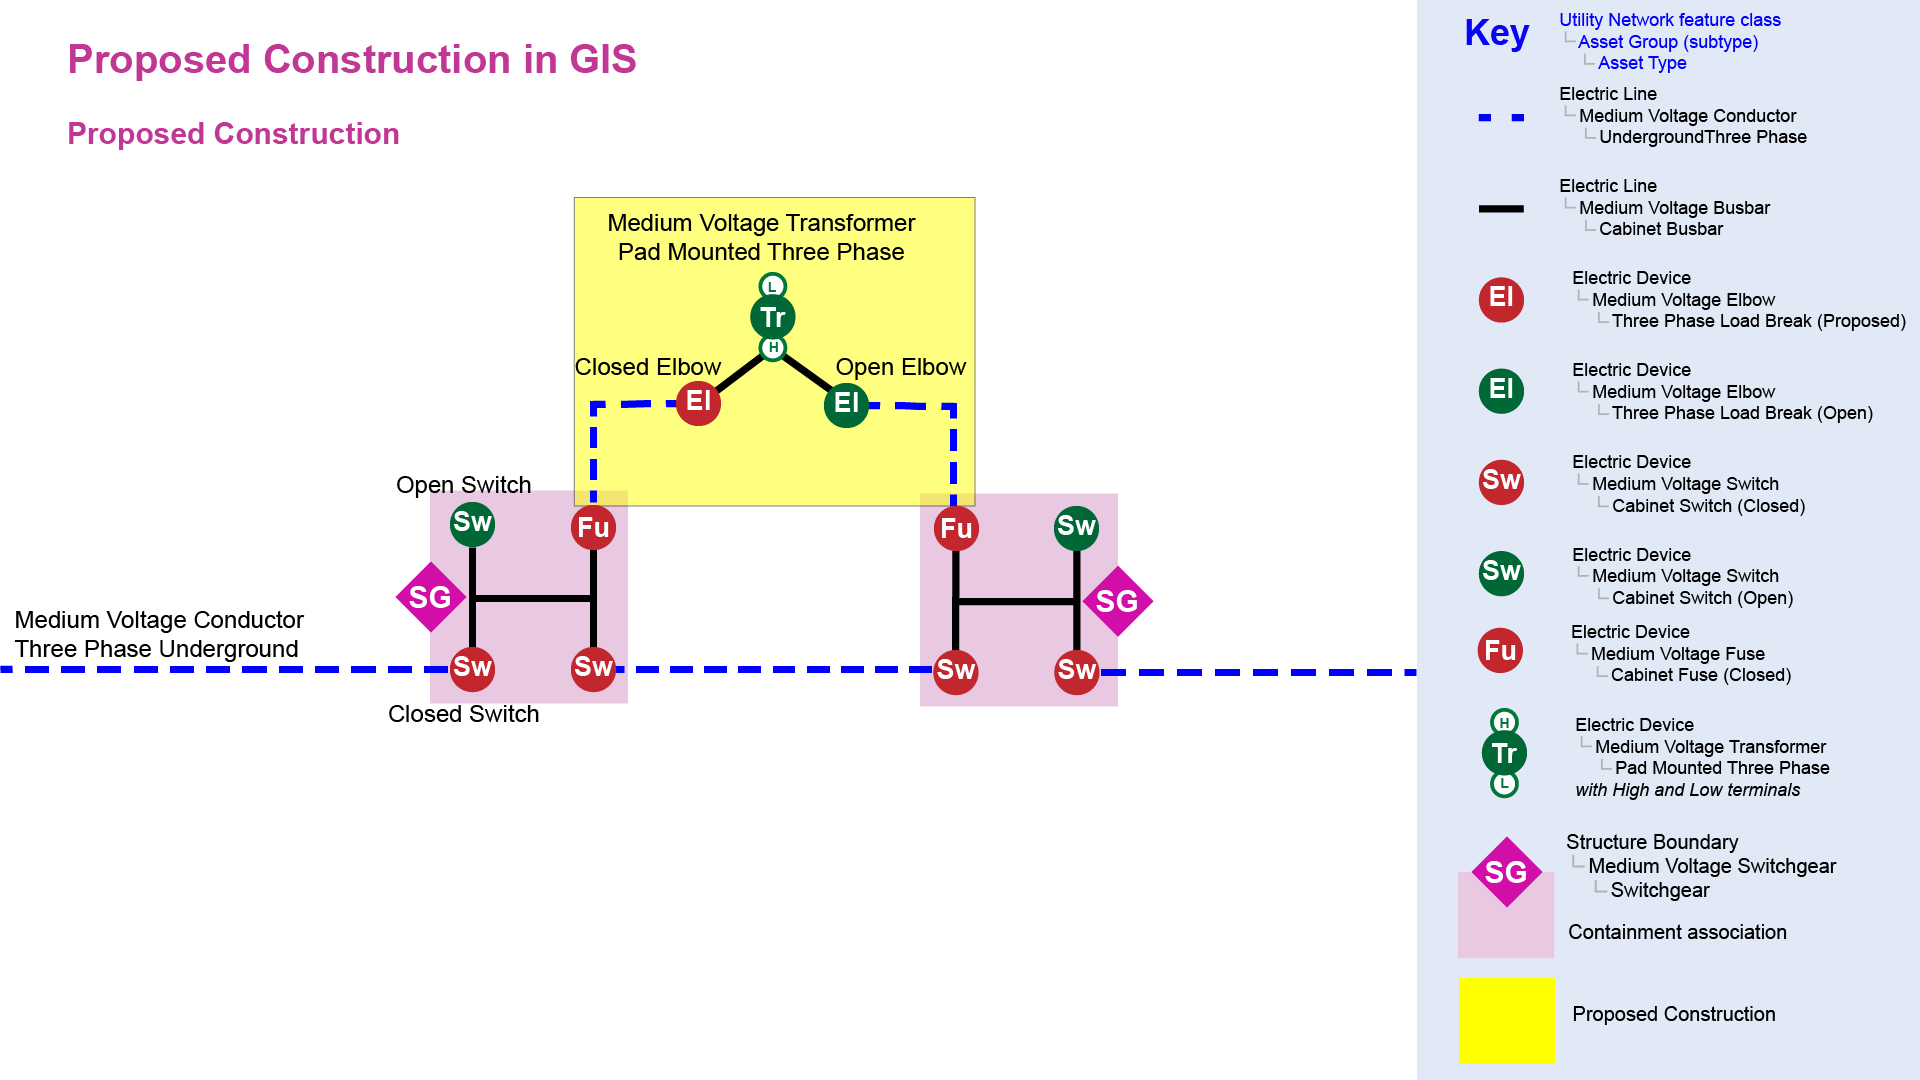
Those of you who are already familiar with these workflows know the challenges associated with managing proposed construction in any system. Most software is designed to represent the current state of the world and simultaneously representing the current state and future state of a system requires custom solutions or complicated workflows. The utility network makes this process easier because the model comes pre-configured to respect fields like lifecycle status. The utility network is configured to represent the as-built state of the network and knows not to energize any proposed construction.
Trace Configurations
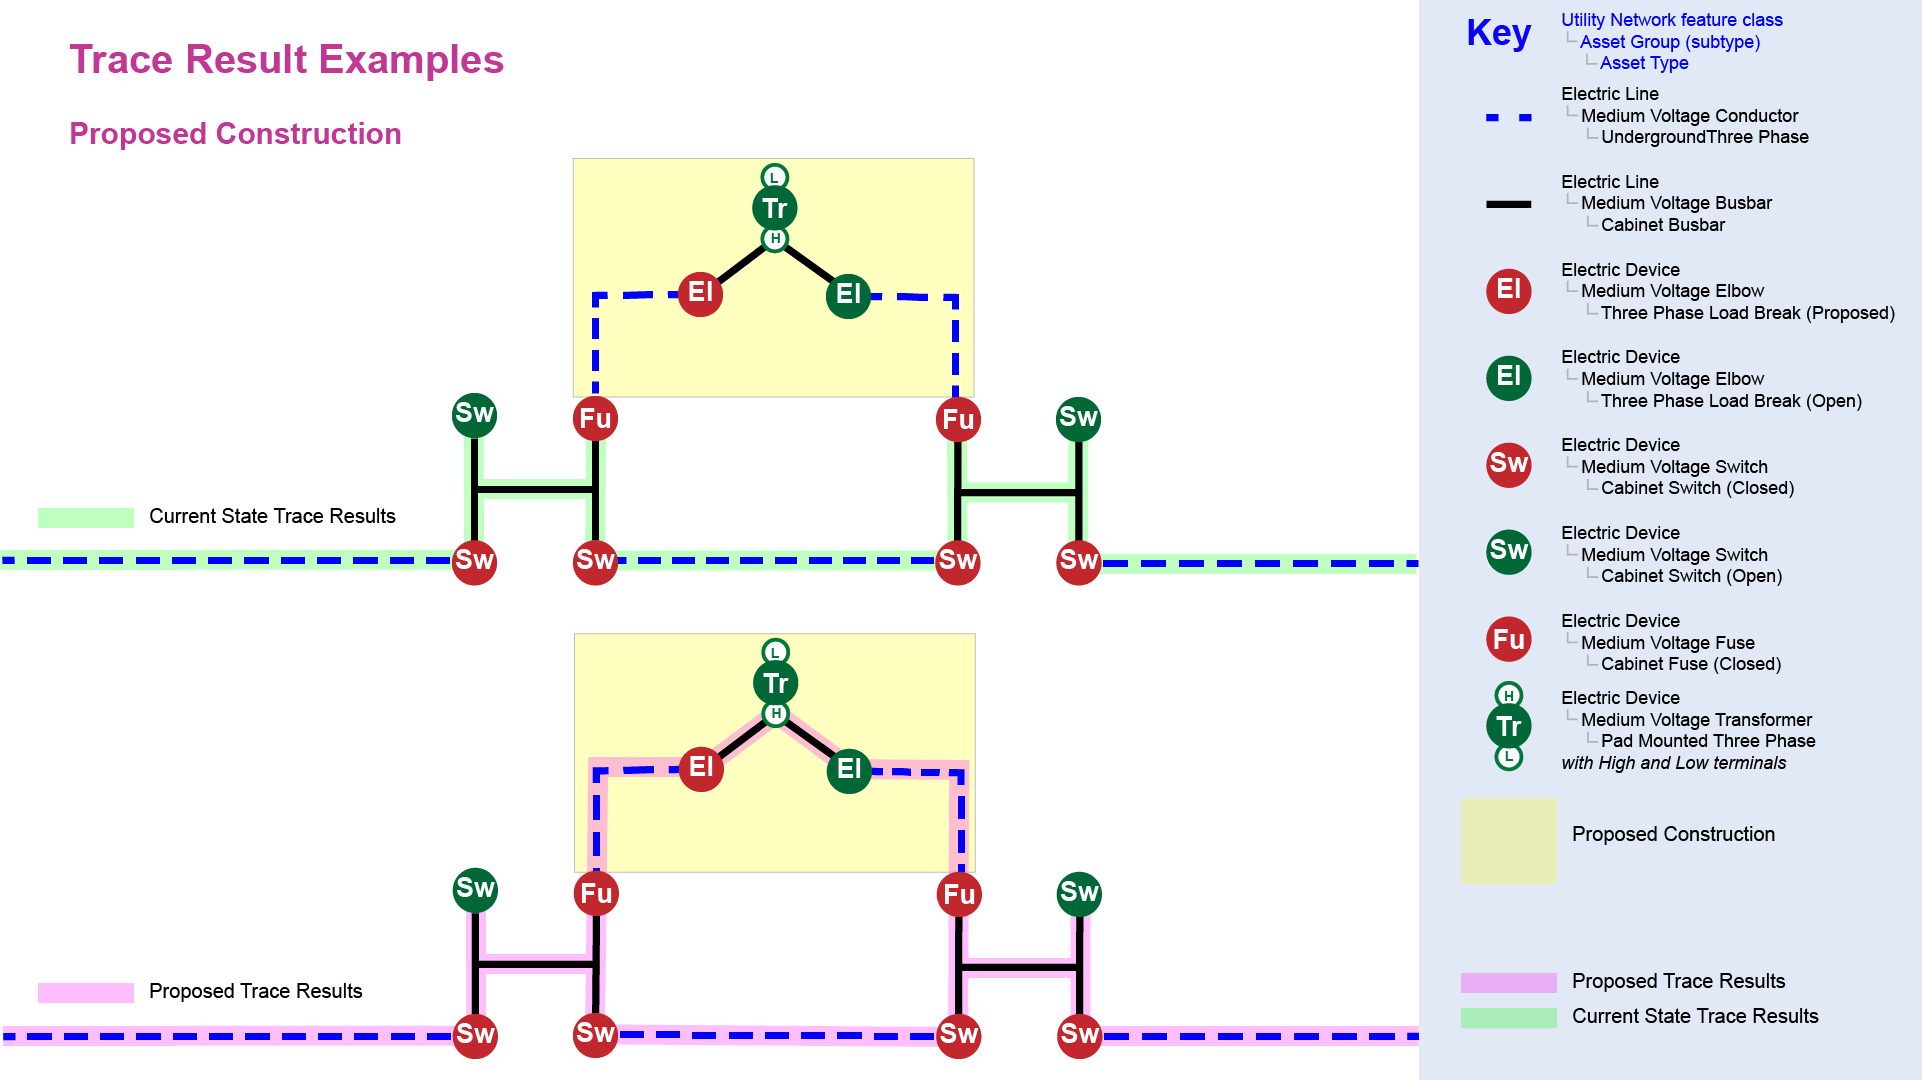
The utility network also allows different named trace configurations that allow users to analyze or model different network conditions. For the workflow we are describing here we will rely on three separate named trace configurations that use this lifecycle status field:
- As Built – This is the default network state. It will include the as built features along with any features that have a state of “planned removal”.
- Future State – This configuration will include all “in service” and “proposed” features in the network model and exclude any features that have a state of “planned removal”.
- Operations Extract – This configuration will include all “in service” and “proposed” features. This will ensure that the OMS has access to all existing features and features that are pending construction.
Now that we can see all the existing and proposed features from the GIS in our OMS there is one more challenge we need to overcome. If we import the current state and future state of the network as-is, proposed construction will appear energized in the OMS. This must be addressed to prevent confusion and potential safety issues to ensure that operators have an accurate view of the state of the network. The solution is to make one minor adjustment to this workflow, and it uses a technique that the GIS and operations are already relying on to model normally de-energized equipment in the GIS such as dead spans and transfer busses in substations.
Tie Points
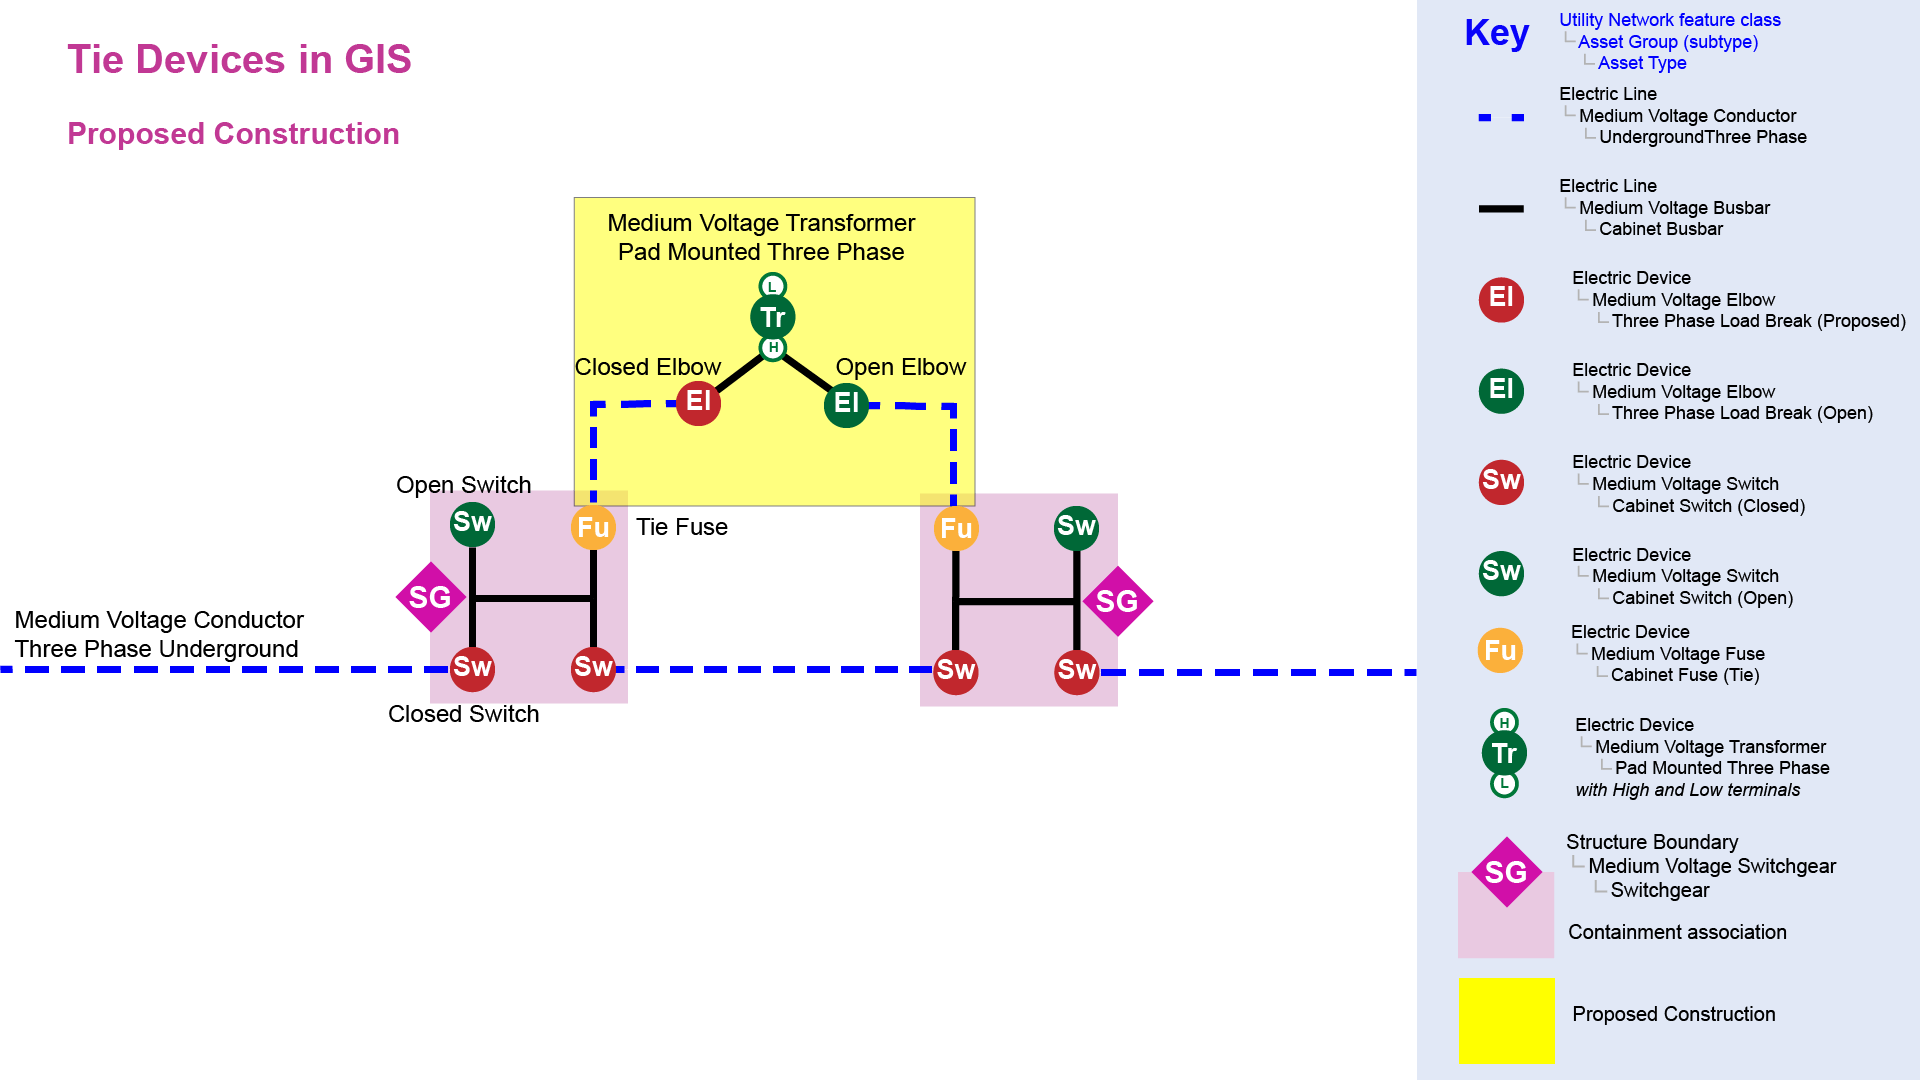
The final piece of the puzzle is how does the utility network information model allow us to represent de-energized features for use with an OMS? To answer this question, we need to look at the three fields that control how features are energized in the model: lifecycle status, phasing, and device status.
- When energizing a feature, lifecycle status controls whether a feature should be considered part of the network or not.
- The phasing of the feature is evaluated against the phasing available to the feature to determine whether the feature can be energized.
- Once a feature has been energized the status of the device is evaluated to determine whether the feature will allow features downstream from it to be energized. For example, an open switch will not allow power to flow from one terminal on the switch to the other terminal.
So how do we use this to manage proposed construction, dead spans, and transfer busses? Switchable devices have three states that determine whether they act as barriers in the network.
- Closed – This is the default state, it never acts as a barrier.
- Open – This state allows a device to always act as a barrier.
- Open, Traceable – This state allows the feature to act as a barrier for the normal state of the network (Open) but allows specific workflows to also treat is as a closed switch (Traceable) for the purposes of discovering the normally de-energized features downstream from the device.
The “Open, Traceable” state ensures that proposed construction, dead spans, and transfer busses are not shown as energized in the GIS. This is because the device prevents them from being energized when tracing or updating the circuit. When the OMS extract the same circuit it will treat that same device as a closed switch, allowing it to discover and include these features as part of the OMS network model. Once the features are imported into the OMS these “Open, Traceable” devices are once again treated as barriers, allowing the downstream features to once again appear as de-energized.
Conclusion
By using proposed features, trace configurations, and tie points the ArcGIS Utility Network addresses the core workflows for modelling features from design to operations without any customization. This is just the launching off point for more detailed conversations about workflows and I look forward to seeing how our partners and customers are addressing these challenges as we move forward together!




Commenting is no longer enabled for this article