Meet our guest authors:
Jonathan L Wilson, PhD is partner and Chief Data Scientist for Retail Scientifics with over a decade of experience delivering best-in-class custom predictive models for a wide variety of clients. Zack Garza is the Sr. Math Wizard for Retail Scientifics specializing in Python, R, and mathematically intensive projects.
Introduction
When it comes to solving the problems we face in the world today, we need the best available tools. Often, that means needing to integrate multiple platforms together. Unfortunately, this task can be unnecessarily time-consuming and complicated, especially when specific pieces do not ‘play nicely’ together. Additionally, with the ever-increasing size of data available to analyze and the demand for automated methods to generate the latest results instantly, analysts and data scientists alike are finding their time increasingly stretched thin. ArcGIS seeks to help mitigate these issues by providing a framework for integration between platforms at multiple levels.
The free and open-source R ecosystem is one of the most widely used statistical programming languages. It provides a large collection of predictive machine learning algorithms for data scientists and analysts to leverage, along with an active and vibrant support community producing high-quality documentation and resources. As such, R tends to be on the forefront of cutting-edge predictive analytics methods and novel field-specific statistical algorithms. The GIS-focused software ArcGIS, offers a powerful suite of vetted spatial analysis methods combined with an extensive platform to ease a variety of tasks that utilize its rich spatial data, dynamic mapping, visualization capabilities, and integration with Python.
Here we present one such example of an integrated solution designed by Retail Scientifics to leverage the power of R from within the ESRI ecosystem using ESRI’s Web AppBuilder framework as a web-based front-end application. This approach allows data scientists to develop high quality technical models within R, while simultaneously allowing non-technical users to employ these models via a user-friendly, spatially-enabled interface.
Example: Retail Site Selection
Predictive modeling in areas such as sales forecasting, marketing, and operations analysis is a necessity to thrive in today’s business environment. A significant competitive advantage can be gained by combining such modeling with spatial data. For example, a common scenario in the retail world is a desire for a retailer to expand by opening new locations. As this typically requires significant financial investments, predicting future performance is a key way of prioritizing which locations might yield the most potential revenue. With such revenue forecasts in hand, one can be much more confident about the possible relative performance of a location before making high-risk, capital-intensive decisions.
Approaches to revenue forecasting have evolved considerably over time, from simple summaries of population and income data, to computationally-intensive ensemble modeling techniques that incorporate historical trends and performance. In the presence of big data however, what might have been possible for a traditional analyst to accomplish with simple techniques, such as linear regression, now requires considerably more programmatic horsepower to obtain accurate forecasts.
In support of the more contemporary approaches, each potential retail location can be enriched with thousands of demographic variables, as well as a host of other spatial data such as expenditures and location attributes — all of which can be used in the construction of a predictive model. It is a complex task to ensure that the model is built correctly, particularly when working with a large volume of data that is typically highly correlated, but such models can yield highly accurate forecasts that can quantitatively inform enterprise decisions and create immense value.
The front-end interface using ESRI’s WebApp Builder marries up easily to use cloud-based services with the high-powered R-based models developed for predictive modeling. This creates a useful bridge allowing for data scientists to build complex models which can be leveraged by non-technical individuals within the business.
Building a Model
Examples of powerful algorithms commonly used for forecasting in enterprise applications (such as revenue prediction, marketing applications, operation analysis, pricing optimization, and more) include, but are not limited to, regularized generalized linear models, neural networks, and spatial regression. While a number of these algorithms are integrated into the ArcGIS platform, niche libraries tailored for specific prediction types are easily available as R packages, which can be installed with a single line of code.
For those interested in building models directly, please see the Github repository for a more detailed view of how such models can be constructed and used to generate forecasts. For demonstrative purposes we utilize one of the simplest type of models in this example: an ordinary linear regression. However, for actual applications and greater predictive accuracy, it is advised to test the application of more contemporary algorithms and techniques.
Using the Model
To solve the challenge of delivering a complex and computationally intensive predictive model to non-technical users, Retail Scientifics has developed an easy to use web-based front-end built on Web AppBuilder, which calls a cloud-based API that references R code for the model. Once a model is constructed and properly calibrated by a skilled data scientist, this approach allows the model to be leveraged by a broad range of users through a simple form interface.
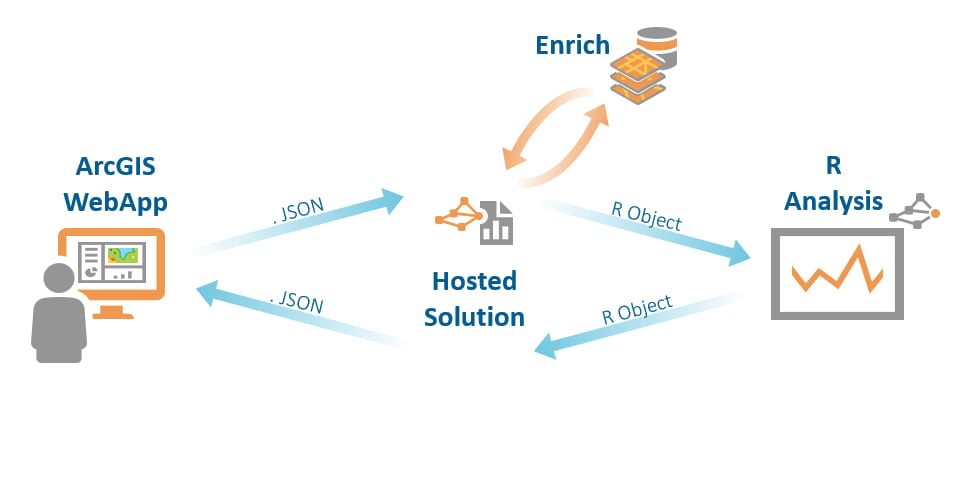
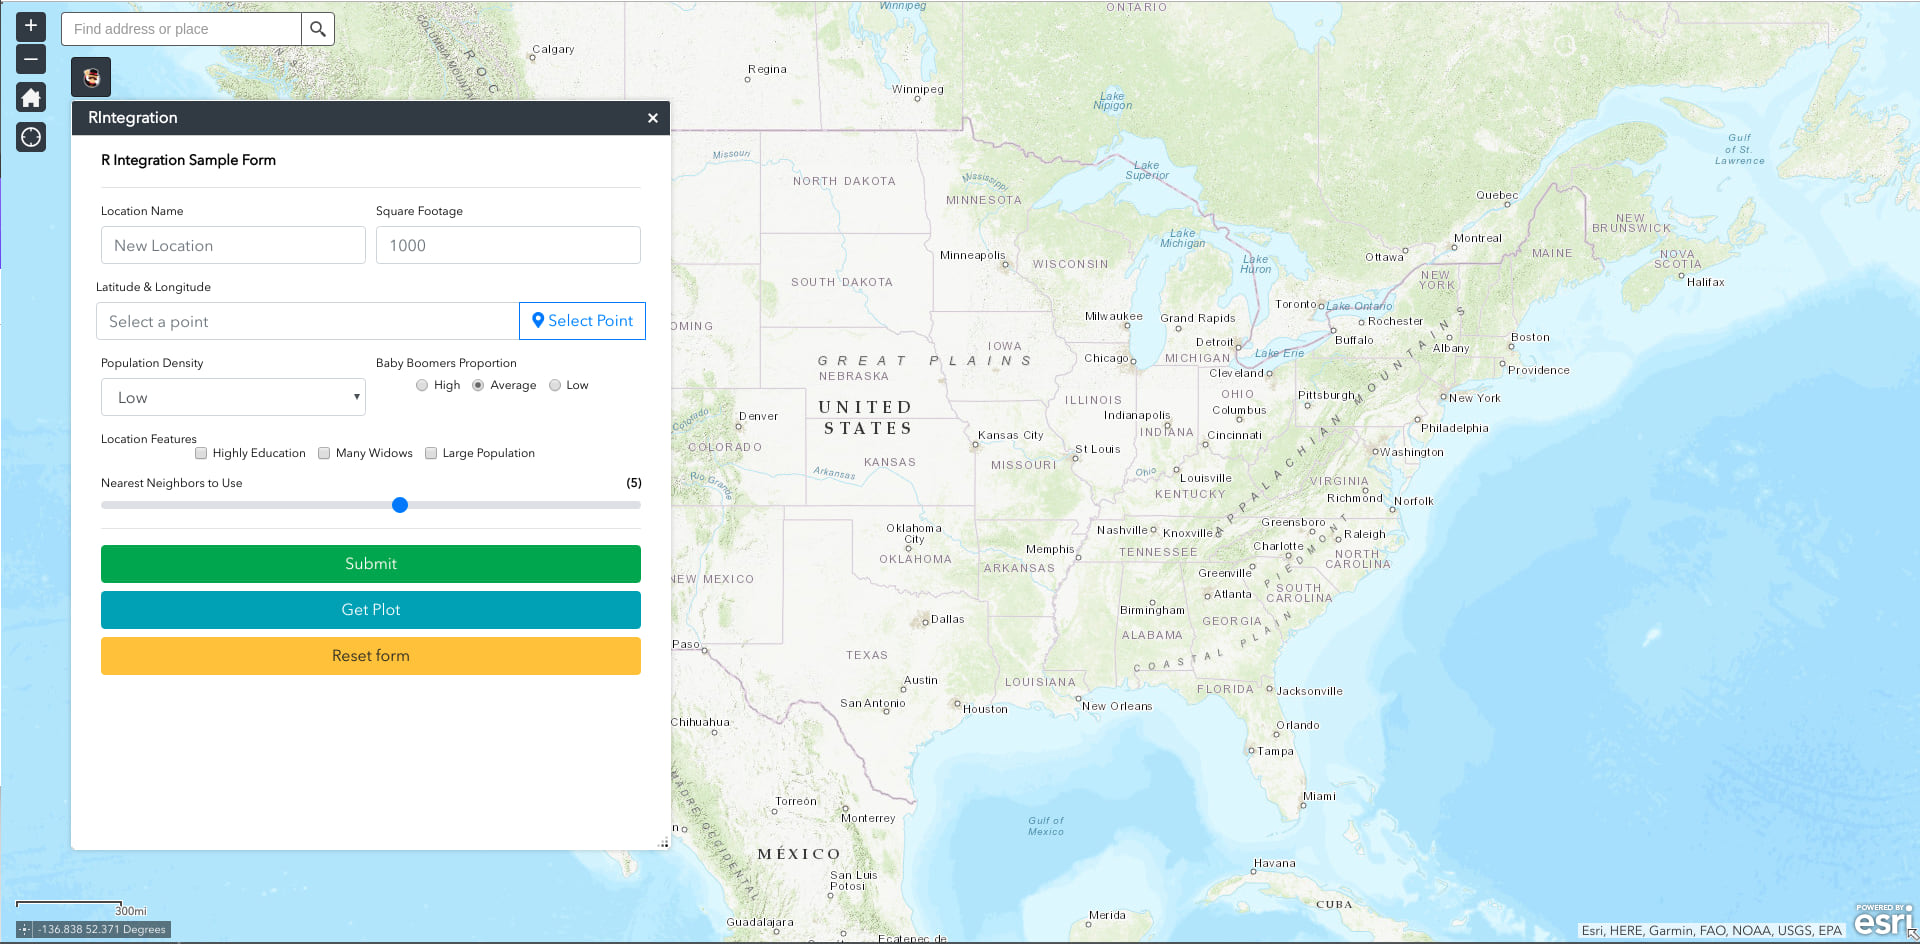
We present an example of this integration below for a multi-outlet sales forecasting application, along with a live demonstration that can be accessed here. For a user to obtain a new prediction, they simply click on the map to identify a location to execute the model, enter a few key site characteristics, and click the “Run Estimate” button.
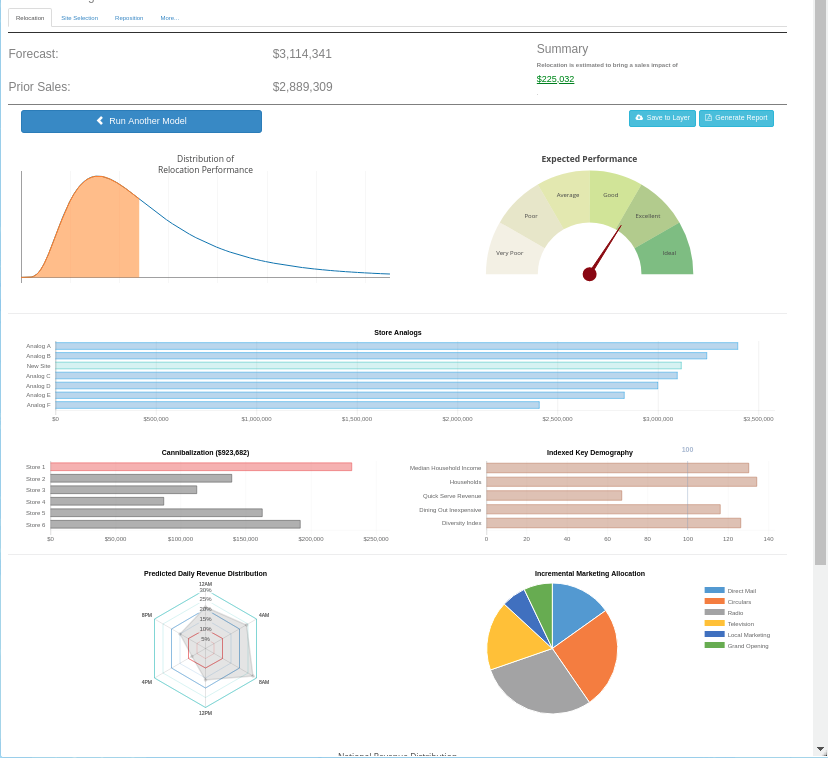
The R model is then called behind the scenes via the API and returns structured data back to the ESRI front-end, which includes the dynamically generated estimate from the predictive model. In production deployments, the output is often quite customized, including more spatial and client-specific data, which we then structure into various charts and tables to yield a comprehensive report:
Possible Extensions
The above example highlights how powerful functionality can easily be accessed in an approachable and user-friendly format. Such a workflow can also be expanded to utilize the R-ArcGIS bridge. The arcgisbinding package, for example, offers the ability to easily convert between a variety of ArcGIS data types, including file-based geodatabases, layer files, hosted feature layers, raster layers, and more. This package extends the functionality of existing spatial R packages, with the added benefit of being able to perform custom data manipulations like subsets, selections based on SQL queries, and reprojections, all within the same function call.
Integration across multiple platforms allows for the development of analytical tools that are not only powerful in their methodology, but also easy to share and approachable for users. This is a great example of how integration helps drive us forward to solve bigger problems in new ways. For further discussions about what the R-ArcGIS bridge can do for your workflows, check out our GeoNet community or feel free to send an email. If you have questions or would like to learn more about this solution, do not hesitate to get in touch with Retail Scientifics.
About Retail Scientifics
Retail Scientifics is a boutique data science consulting firm. Many of our clients leverage our custom-built spatial analytics models and tools through ESRI platforms. We are experts in modeling, data collection and analysis, and are the market leaders in prediction accuracy. We have expertise in combining spatial and statistical analytics, particularly in the retail and restaurant domains.
Visit us as https://www.retailscientifics.com/ or via email at info@retailscientifics.com
This content was coauthored by Jonathan L. Wilson PhD, Marjean Pobuda, and Zack Garza

Commenting is not enabled for this article.