Skip to Content

Climate Action

Location-based solutions drive successful adaptation and mitigation

Download the Climate Checklist

Geography is key to climate resilience

Today, organizations are finding new ways to adapt and thrive with geospatial technology that is uniquely poised to meet this moment.

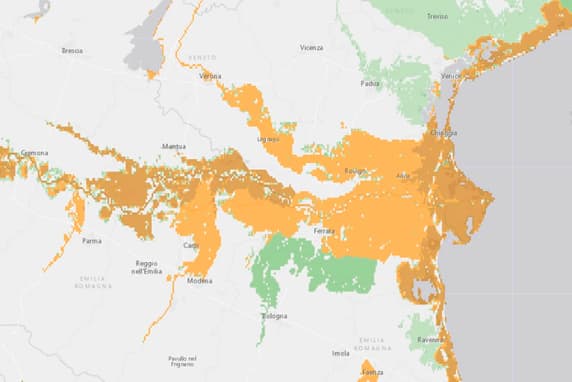
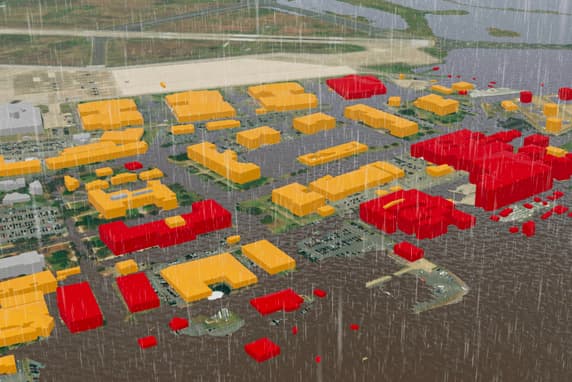
The life-altering effects of a changing climate are inherently geographic. Risks, impacts, and solutions exist in specific places and require location-based problem-solving.

A geographic approach

Understanding climate data in the context of location helps decision-makers model scenarios, pinpoint risk, and adapt.

Location technology

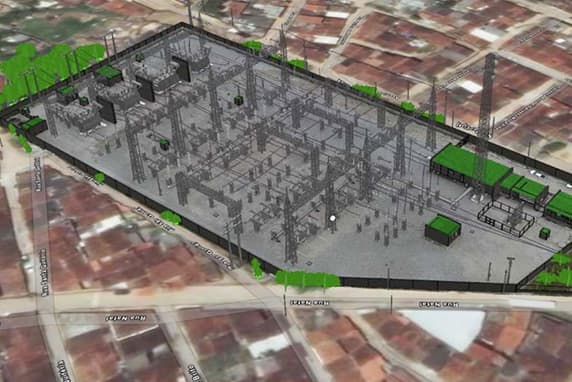
Geographic information system (GIS) technology provides the tools to collect, view, manage, analyze, and share climate data.

Insights that fuel action

Business, government, and community leaders use location intelligence from GIS analysis to understand changing conditions and act quickly.

Map of corn suitability with time slider bar that shows conditions today and the middle of the century and farmer walking through corn fields

Understand changing conditions

Predictive analytics show how dark green areas suitable for corn today (left) shift northward by the middle of the century as temperatures rise (right).

A proven leader in climate risk analytics

Organizations around the world use Esri’s geospatial technology to promote sustainable solutions to the climate crisis.

Facilitating progress

Hundreds of thousands of organizations globally, including Fortune 500 companies, rely on Esri’s GIS technology to inform strategic decisions.

Building the world’s most powerful GIS

Esri’s GIS software provides trusted mapping and spatial analytics plus access to thousands of authoritative datasets, maps, and expert guidance.

A recognized leader

The Forrester New Wave™: Climate Risk Analytics, Q4 2022 report recognizes Esri for its leading data visualizations and advanced data processing.

Buildings along the sea and into the hills of Grenada and Model that shows how flooding would impact buildings in Grenada.

Visualize and model threats

In this virtual representation of Grenada, 3D modeling shows how a four-meter sea level rise will impact infrastructure (dark blue) and other areas at risk of flooding (light blue).

If you have physical assets that could be threatened by climate, Esri can bring the data and processes to bear to target operational resiliency opportunities.

If you have physical assets that could be threatened by climate, Esri can bring the data and processes to bear to target operational resiliency opportunities.

–The Forrester New Wave™: Climate Risk Analytics, Q4 2022

From science to action: National climate agency reveals climate risk with GIS technology

The National Oceanic and Atmospheric Administration’s Climate Mapping for Resilience and Adaptation Portal (CMRA)—created in partnership with the White House—provides community and business leaders with unprecedented access to climate data.

More on CMRA

Understand climate risk with the powerful analytics and high-tech maps in GIS

Dynamic maps enriched with accurate data reveal patterns, trends, and relationships that help leaders address risks from climate-related events.

Biodiversity loss

Accessing and mapping robust data on species, protected areas, and human activity reveal the places where focused climate action can safeguard the long-term health of the planet.

Flooding

Modeling flooding impacts with projections tailored to specific infrastructure and assets provides the precision decision-makers need to prepare for any scenario—from the best-case scenario to the worst.

Drought

With spatial analysis and visualizations of drought-impacted areas, leaders can make informed decisions to ensure water resources can sustain energy, agriculture, and residential needs in the future.

Wildfire

Maps of historic and real-time wildfire data and predictive analytics inform climate-aware plans that safeguard communities, critical infrastructure, and forest ecosystems.

Extreme heat

Spatial analytics provide an intuitive way to understand the multi-dimensional nature of extreme heat with maps that reveal areas of high vulnerability. Leaders can use those insights to better manage changing needs and determine ideal places for efforts such as green space development.

Take climate action with GIS

GIS connects data and analysis to provide a holistic picture of current and future climate-related hazards. These insights inform new climate action solutions that will protect people and places.

Previous
Next

How organizations are solving climate challenges

  • Aerial view of the City of Prague
    GOVERNMENT

    City of Prague creates lasting change with location intelligence

    To adapt to increasing heatwaves, Prague identified hotspots and pinpointed the best places to plant new vegetation with GIS and satellite imagery.

  • Aerial view of a hurricane
    TELECOMMUNICATIONS

    AT&T taps advanced analytics to map decades of climate risk

    A ground-breaking climate analysis tool predicts where climate risk will affect AT&T’s business for the next 30 years.

  • Map of climate data shown in orange and green
    FINANCIAL SERVICES

    Bouwinvest brings climate risk assessments in-house with GIS

    On a GIS climate dashboard, investment managers can quickly see present-day risk for investments, plus trends that may develop in a specific area over the next decade.

  • Waterlogged peatlands surrounded by a forest
    CONSERVATION

    Saving Canada’s peatlands to help stabilize the climate

    As wildfire and mining-related threats to peatlands ramp up in Canada, conservationists work with Indigenous groups for the preservation of this carbon-absorbing ecosystem.

  • Rendering of a substation
    UTILITIES

    A network digital twin helps Brazil utility expand renewable energy

    As Eletrobras Chesf works to meet growing demand for renewable energy sources, a virtual representation of the network improves communication and efficiency.

  • Computer model showing flooding impacts on buildings
    BUSINESS & GOVERNMENT

    Predicting storm impacts with location analytics, AI

    Enlightening 3D models show executives what can happen to assets during extreme weather events and the best ways to respond.

  • Aerial view of roadway with cars on it
    ENERGY

    Accelerating the energy transition on US roads and highways

    Determining where infrastructure investments will best support electric vehicles is critical to decarbonizing the transportation system.

Previous
Next

Framework for climate resilience

Esri’s enterprise-grade GIS technology provides a powerful framework for visualizing and understanding massive amounts of climate data. The Climate Checklist details how government and business leaders can use this this proven approach to assess and minimize climate risks using GIS technology.

Previous
Next
Download the Climate Checklist

Connect with an expert on climate action

Connect with an Esri expert on climate action to discuss how GIS can support your organization’s mission and goals.