Skip to Content

ArcGIS Monitor Features

Collage of various graphs with numbers, symbols, and text overlaid on a screenshot showing

System monitoring for your enterprise GIS

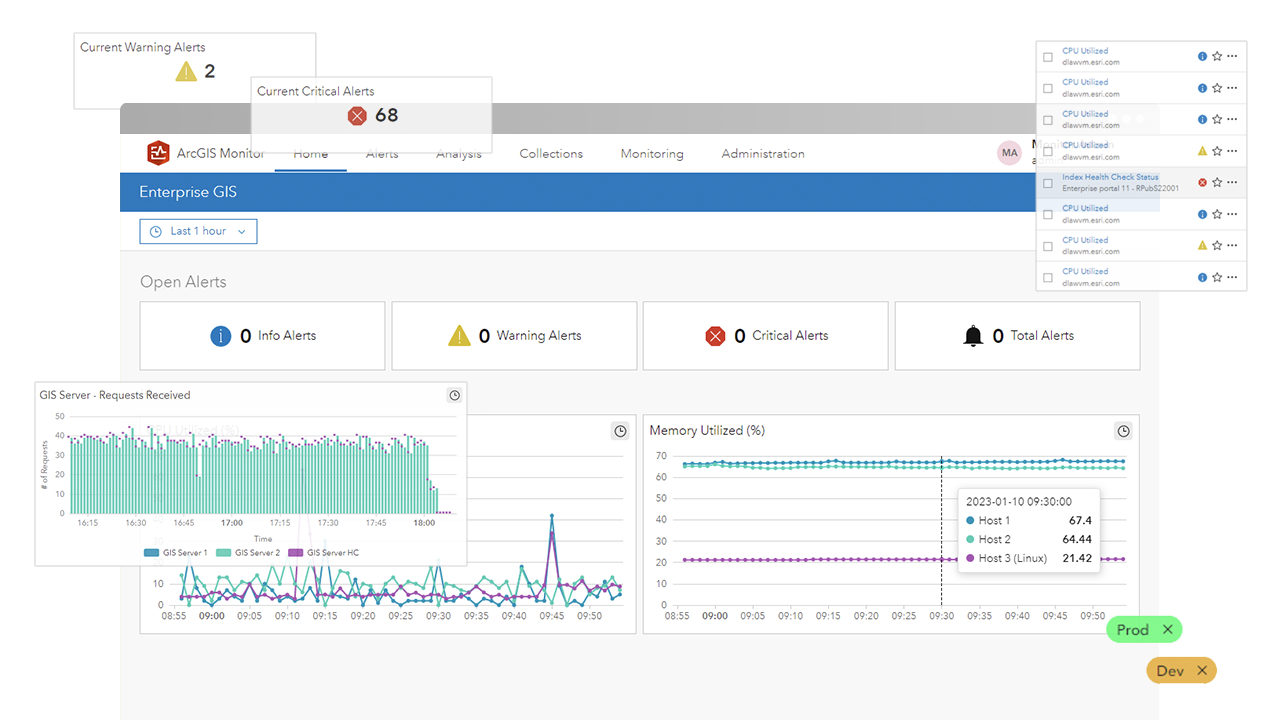
ArcGIS Monitor provides operational awareness through holistic monitoring for all tiers of your enterprise geographic information system (GIS) deployment. Collect and manage data metrics for health (such as uptime, errors, and SLA), performance (response time), load (request rate), and infrastructure utilization (such as CPU, RAM, disk, and network) of your enterprise GIS.

A desktop dashboard showing multiple graphs and numerical data.

Custom data metrics

Under the Analysis tab, you can configure custom views to show data metrics for ArcGIS Enterprise and its infrastructure. This can help you make informed decisions for optimizing your GIS investment. For example, if your web services have a high volume of requests, but their response times are high, you could allocate more instances to improve their performance.

A colorful line graph in ArcGIS Server analyzing average request response times per service

System integration

ArcGIS Monitor supports webhooks with collections to activate external applications or code. For example, open a maintenance ticket if components begin to fail or get notified when additional resources (such as CPU or memory) are needed when capacity is reached or exceeded.

A dashboard displaying multicolored donut charts and other data

Talk to someone on our sales team

1-800-447-9778

7:00 a.m.–5:00 p.m., Monday through Friday (PT)

Outside the US?