Chat online
Start chat

See real-time big data in context
Make informed decisions by mapping real-time big data.
Have streaming data? We've got the configurable inputs for any kind of data. Be it stationary sensors such as weather stations, moving assets such as vehicles, or point-in-time events like crime and accidents, ArcGIS GeoEvent Server and ArcGIS Velocity can receive and analyze events from that data stream.
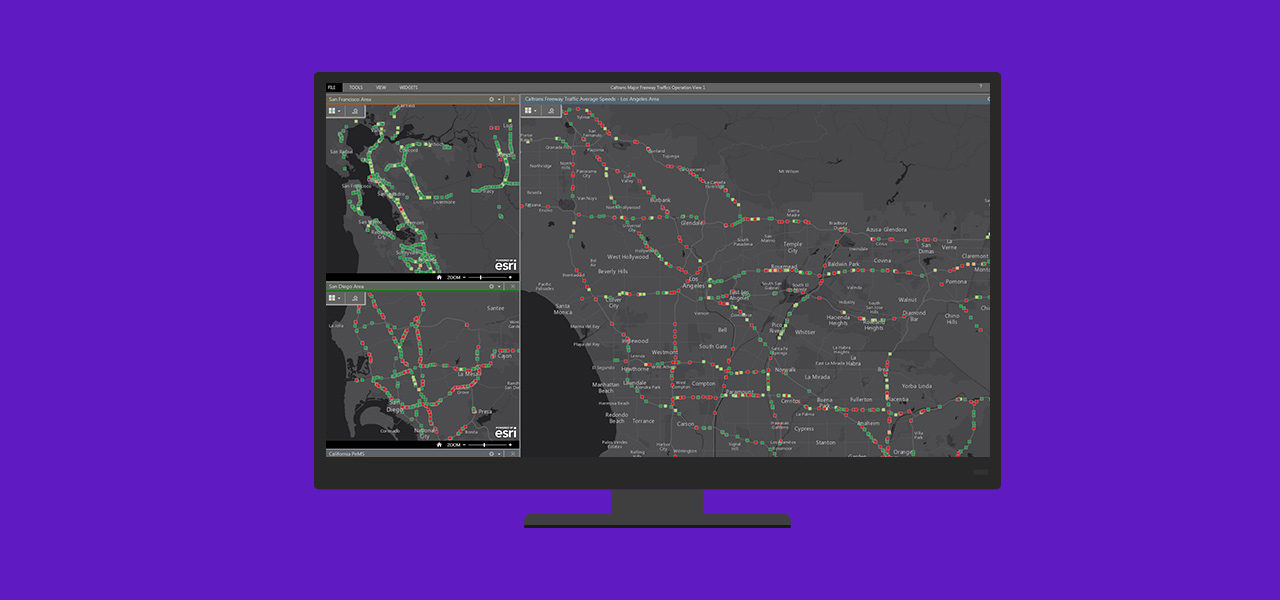
Visualize your IoT data on a dynamic dashboard with charts, gauges, maps, and other visual elements that show the status and performance of vital assets and events in real time. Operations Dashboard for ArcGIS is the perfect tool to deliver a complete operating picture of your real-time, big data.
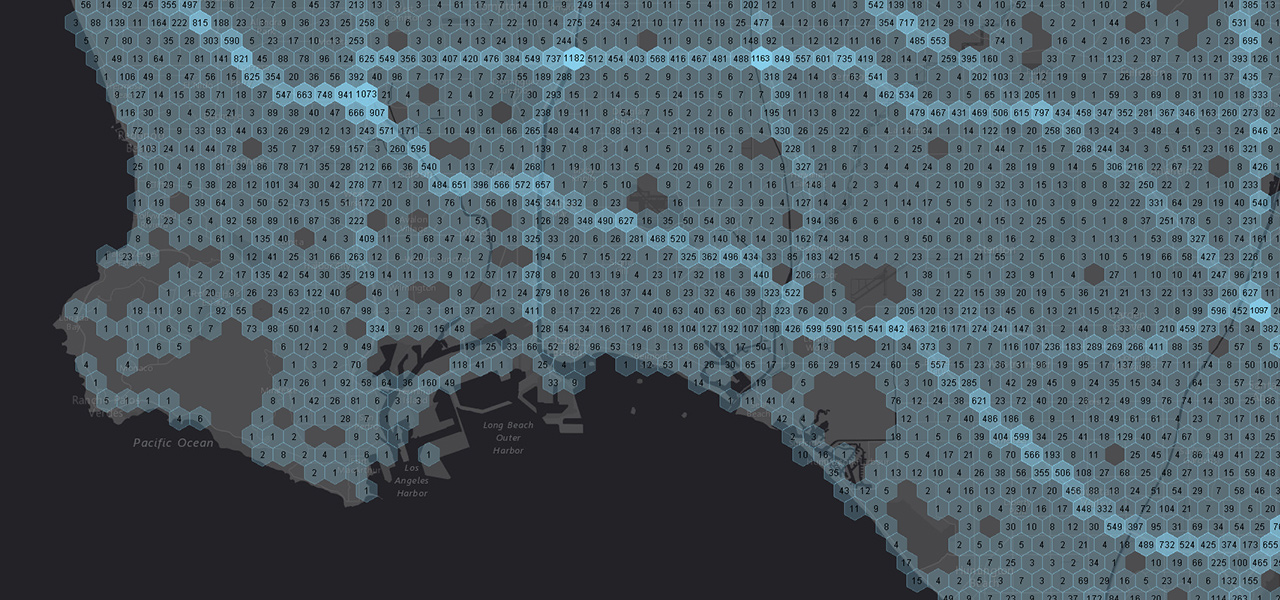
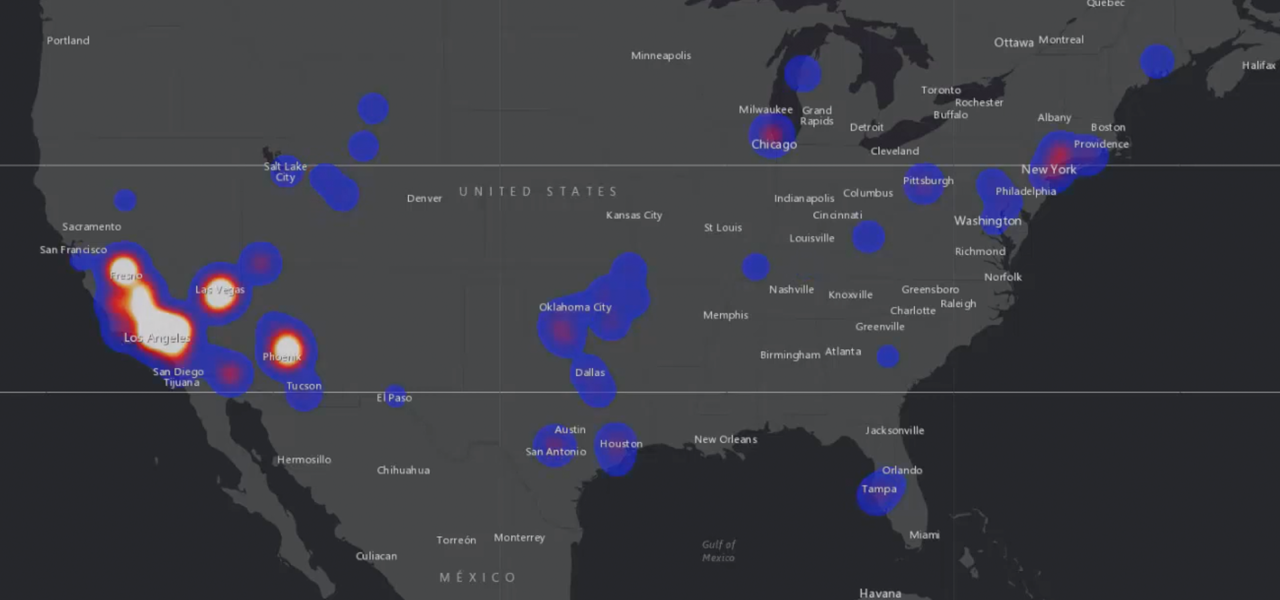
Visualize patterns, relationships, anomalies, and incidents in large amounts of data. Leverage ArcGIS GeoAnalytics Server or ArcGIS Velocity to analyze big datasets and visualize insights to make more informed decisions.
7:00 a.m.–5:00 p.m., Monday through Friday (PT)