The purpose of digital delivery is to move UDOT away from static data and instead use dynamic data to represent the current state of every asset.
Corey Unger
Spatial Technologies Manager, UDOT
Customer
Utah Department of Transportation (UDOT)
Challenge
The wide-ranging weather in Utah made it difficult to plan and implement optimal road striping, and UDOT was lacking current data on the condition of roadways to effectively maintain them.
Solution
UDOT started collecting data by drone using Site Scan for ArcGIS to develop a digital twin. UDOT also worked with Esri through the Esri Advantage Program for help with creating a machine-learning model and methodology that would move the department from manual digitization of assets to asset detection leveraging automated processes.
Result
Through drone imagery and digital delivery, UDOT has gained dynamic data to represent the current state of every asset. Coupled with continued automation and machine-learning efforts, UDOT can more effectively maintain its roadways for optimal driving experiences.
The Utah Department of Transportation (UDOT) is responsible for planning, designing, building, maintaining, and operating the state highway system. It maintains major roads and moves traffic over long distances including the interstate. Team members at UDOT believe that good roads cost less, and with proactive preservation, they can maximize the value of their infrastructure for today and the future.
 Drone imagery provides an aerial view of Utah’s highway system.
Understanding the location and condition of assets helps UDOT make every dollar go farther by prioritizing maintenance and construction efforts to provide the greatest good to the traveling public. By combining the asset location data with other roadway characteristics, such as traffic volume, speed limit, and crash frequency and severity, UDOT can prioritize projects to maximize their utility. Ensuring that the digital representation of these assets is as accurate and up-to-date as possible is critical to their usefulness.
UDOT uses mobile lidar to collect pavement information every year. Pavement striping and markings are important to track because they communicate information to road users like no other traffic control device including a variety of important driving tasks. A recent Federal Highway Administration report shows the US spends approximately $2 billion annually on pavement marking. Corey Unger, the spatial technologies manager at UDOT said, “It’s not only beneficial to human drivers but also to emerging autodriving technology.”
While pavement marking is critical to maintain, Utah’s wide-ranging climate makes this task difficult. The varying weather creates a tricky environment for planning and implementing the optimal type of striping, and UDOT has received criticism as a result.
 Utah’s wide-ranging climate makes inspection and maintenance tasks challenging.
To better maintain assets like striping throughout their entire life cycle, UDOT is transforming the way projects are managed with digital delivery. This offers the organization new ways to understand, view, and use project design data in the field. Digital delivery for UDOT means the digitization of the project delivery process. Data is compiled and delivered digitally in each stage of the life cycle of a project, from its design to the construction to the return of the data to asset management for future project planning and execution. This transformation led UDOT to create a digital twin, or a digital representation, of all the physical assets that make up Utah's transportation network. It’s part of a powerful and scalable information management strategy.
Unger said, “The purpose of digital delivery is to move UDOT away from static data and instead use dynamic data to represent the current state of every asset.” Data is collected by drone using Site Scan for ArcGIS, which enables end-to-end drone management and direct integration with the ArcGIS system. It allows UDOT to easily overlay design data from the digital delivery process with imagery collected during and after construction on a project. This helps compare the accuracy of how a project was planned and implemented.
 Digital delivery for UDOT means the digitization of the project delivery process.
One example is UDOT’s use of cut/fill analysis on the design surface compared to the elevation of the drone imagery collected for a port of entry project. This kind of analysis informs UDOT whether the road was built too high or too low, as either scenario can lead to dangerous conditions to vehicles, poor drainage, or other potentially hazardous situations. If the on-the-ground elevation is lower than what was designed, it’s considered a cut, and if the on-the-ground elevation is higher than the design, it’s considered a fill.
 UDOT uses cut/fill analysis on drone imagery and the design to compare on-the-ground elevation with the design elevation.
 The cut/fill tool in Site Scan for ArcGIS enables UDOT to outline the location where volumetric analysis needs to be performed.
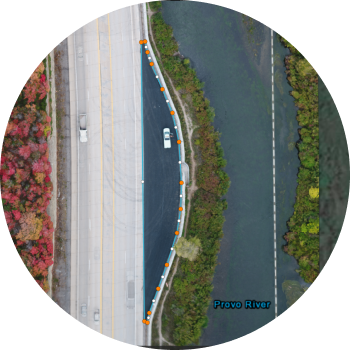
 UDOT performs cut/fill analysis with Site Scan for ArcGIS to estimate the volume of a surface in 3D. The blue area represents the surface captured by drone imagery and yellow indicates the design surface.
The same method is used to compare the designed pavement marking with where it was actually placed. This data gives the project inspector the ability to verify the placement of designed features in the construction as part of UDOT’s digital twin effort. Once the accuracy of these placements is verified, the markings can then be entered into the organization’s asset management system, where UDOT can track the asset’s life cycle and plan and schedule maintenance tasks accordingly.
 UDOT compares placement of markings in a project’s design with where the markings were implemented at the construction site.
While data collection through Site Scan for ArcGIS helped UDOT get closer to achieving a digital twin, the process still required them to manually inspect and pull assets from the imagery. “After pilots would fly sections of roadway, analysts would take the imagery and manually delineate pavement conditions and striping information in ArcGIS Pro,” Unger said. “This was very time-consuming.” So UDOT began exploring an automated process where it could send drone data collected from Site Scan for ArcGIS directly through a GeoAI machine learning model and then extract striping data straight into its database.
UDOT reached out to Esri through the Esri Advantage Program to get its help with creating a machine-learning model and methodology that would move the department from manual digitization of assets to asset detection leveraging automated processes. Esri reviewed UDOT’s program and provided a recommendation for best practices. Esri suggested rule-based modeling, which requires a predefined set of rules that can be applied to an image, so an exploratory assessment was performed.
During analysis of UDOT’s drone data stored in Site Scan for ArcGIS, team members examined two formats: orthorectified imagery and point clouds. They decided to evaluate data in the corresponding workflows for various assets including lane striping, rumble strips, pavement distress, signs, sound barriers, and traffic barriers.
In one example from the initial striping extraction results, a drone image of a road shows a solid striping line, while its coordinating analysis image shows broken striping lines. This can indicate poor striping conditions, but it requires further study. However, it’s still valuable data for maintenance teams so they can target areas where repairs may be needed.
 The drone image on the left is compared to the image on the right, which resulted from analysis. The white stripe that's outlined in red in the right image should be a solid line, like the shoulder marking that's outlined in red in the left image. However, the striping on the right image is broken, likely due to the darker color present in the stripe in the left image.
Another example from preliminary results shows a section of freeway where one can differentiate between concrete and asphalt sections as well as define the striping. Again, this is important information for an accurate inventory of surface type and to help maintenance teams know what type of surface they're going to be working on to repair.
 Automated analysis allows one to easily distinguish between concrete and asphalt surfaces.
Leveraging remotely sensed data coupled with AI and machine learning targets enables quicker and more accurate data collection on infrastructure assets, so infrastructure owners can more quickly address maintenance needs. Site Scan for ArcGIS and the Esri Advantage Program have been critical to digitizing asset inventory and developing machine learning models that will continue to save the organization time and money while also delivering a positive driving experience for its community.
UDOT's goal is to have an automated method for extracting asset conditions from drone imagery to keep asset inventory as up to date as possible. The department plans to use these models as part of its efforts to refine its asset extraction process and expedite completion of the digital twin. Deep learning, artificial intelligence, and UAV imagery collected with Site Scan for ArcGIS are important elements of UDOT's success strategy.
The purpose of digital delivery is to move UDOT away from static data and instead use dynamic data to represent the current state of every asset.
Schedule a conversation with one of our experienced sales consultants. Tell us how you're using imagery and remote sensing data now, and we'll show you where a comprehensive geospatial system can take your work next.