USER STORY
Mobile Water Data Entry Made Easy
By: Andy Simpson, GISP—Information Management Services, Tacoma Water
Originally purchased in 1893 by the City of Tacoma, Tacoma Water is an older water system with over 117 square miles of service area and 1,400 linear miles of water mains. Maintaining exceptional water delivery and quality are top priorities for this utility and its customer base. Although Tacoma Water is rich in tradition, it is always looking for better and cheaper ways to deliver high-quality, affordable water.
To that end, Tacoma Water recently started looking into better ways to record information directly from staff in the field rather than the slower paper-based workflows that had been in place for decades. Specifically, it looked at the water quality sampling and hydrant flow testing as initial use cases.
About five years ago, Tacoma Water converted from AutoCAD to the Esri GIS platform. It now has a fully functional ArcGIS Enterprise production system, which includes ArcGIS Online cloud capabilities. From this platform, Tacoma Water started designing and implementing mobile workflows using Survey123 for ArcGIS.
Water Quality Sampling with Survey123
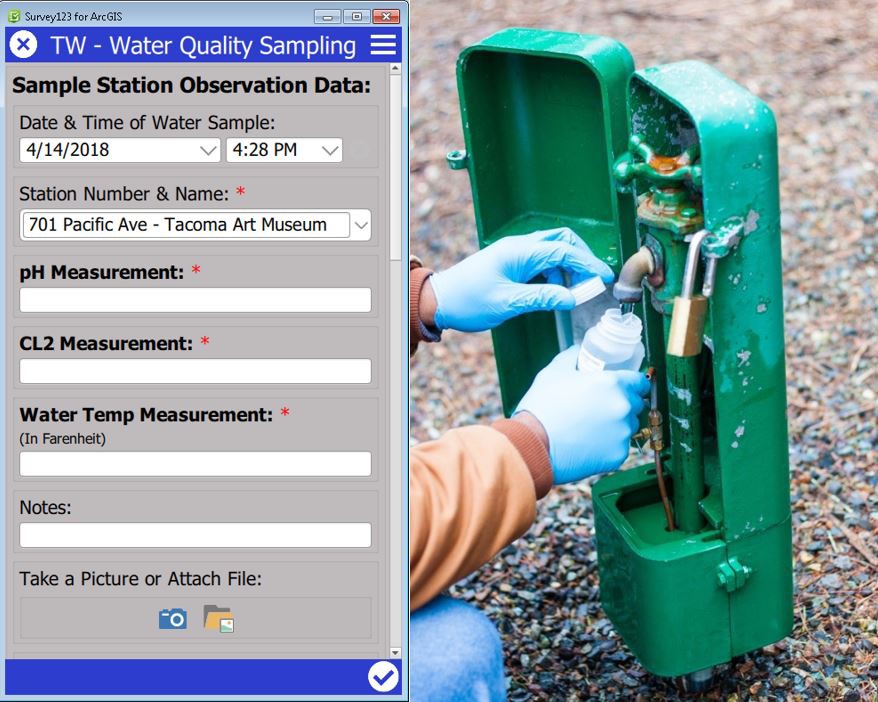
The major indicators of good water quality are residual chlorine (CL) and pH values. Tacoma Water has 110 sample locations spread across its water system. To meet regulatory requirements for clean drinking water, staff are required to visit each of these locations monthly to record both CL and pH values. Historically, at Tacoma Water, this was done by writing each of these values on a paper sheet. When back in the office, the observed data would then be entered into an Access database. This paper-based process does work, but to continually improve, Tacoma Water staff knew that this process was not efficient, results were difficult to communicate, and there was a high risk of entering the wrong information. Additionally, staff felt that the Access database where the data was ultimately placed was difficult to use and, in fact, had become corrupted a couple of times over the years.
Using ArcGIS Online to store sample station locations and Survey123, they were able to eliminate the use of paper in the field and communicate results instantly with the rest of the organization. Kelly Cooper, a water quality technician with Tacoma Water said this of the new process, "It's like magic . . . I put the values into my phone and hit Submit, and the data is instantly reflected on the map." Beyond the regulatory mandated values of chlorine and pH, staff quickly realized that they could also use the same survey to capture additional data points such as turbidity (NTU), conductivity, total coliform, heterotrophic plate count (HPC), fluoride, and E. coli during water leak events.
With a couple clicks of the button, office staff now use a web map hosted in ArcGIS Online to analyze the results for each month. Water quality issues are quickly spotted and can now be further analyzed, and regulatory reporting is much easier.

Hydrant Flow Testing with Survey123
Land developers, insurance companies, and new water customers often pay for a hydrant flow test to better understand fire flows and flow rates at specific locations within the water distribution system. Typically, it takes three to four field staff to perform the hydrant flow testing late at night, often in rainy conditions. The past practice was to record the values from the flow tests by writing them down on paper sheets. Later that week after the test, the staff would take the observed flow rates and plug those values into a series of Excel workbook formulas to calculate the flow results. Staff would then print out a map to go with the results of the test. The map and the results were then given to the customer. Again, to continually improve, staff looked at this process and determined that several parts could be automated to provide better customer service.
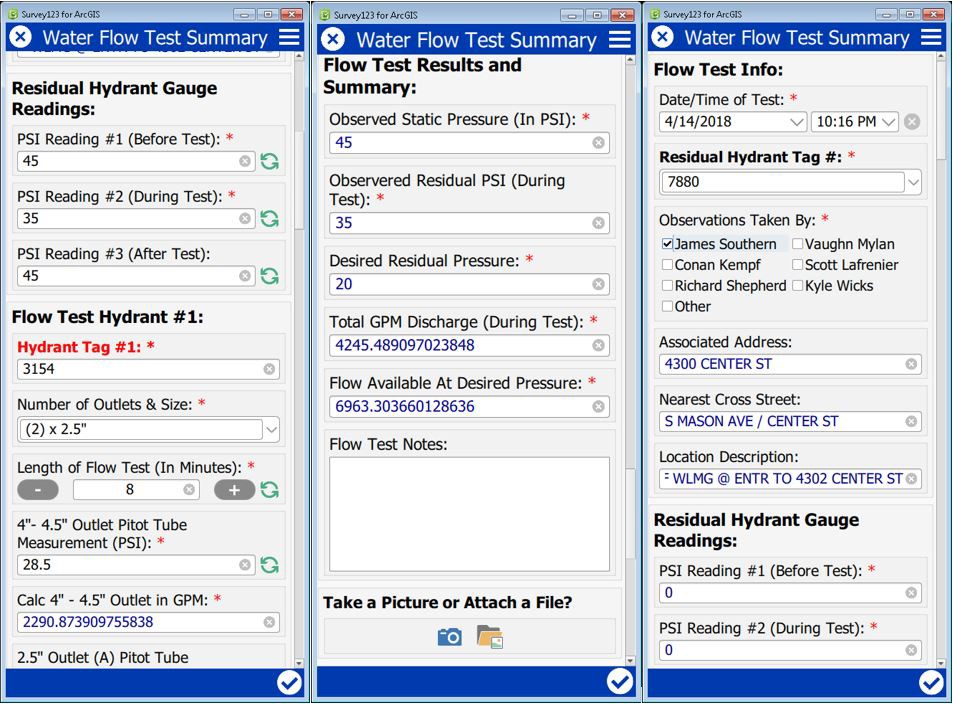
Today, utilizing Survey123, Python, and ArcGIS Online, field staff now have a fully automated way of capturing the flow test results into a Survey123 form. Embedded flow calculations in the form provide the field staff with instant results. The flow results no longer need to be entered in a workbook back in the office. Additionally, Python takes the flow test data from ArcGIS Online and creates a flow test report with a map embedded in the report. The report is emailed to counter staff where it can then be sent to the customer. The results are shared on a dashboard with engineers and management staff where the results can be further analyzed. The new automated process saves time and provides a much quicker turnaround time on hydrant flow tests for customers.

While it has been difficult to quantify the specific amount of money or time saved, Tacoma Water's use of Esri 's Survey123 and ArcGIS Online has helped create smarter, more efficient ways of entering observation type of data from the field. Also, the ability to communicate those results, which was not previously possible with the paper data capture method, is a major benefit to the rest of the organization. Beyond these shorter-term benefits, Tacoma Water believes that the longer-term benefits of near real-time information from field observations will eventually translate to quicker and better decision-making at all levels within the organization. They believe that this will eventually lead to greater efficiencies down the road that have not yet been realized. The Esri GIS software platform is creating a positive change at Tacoma Water that helps with the ongoing efforts of providing clean, reliable, and affordable water for current and future water customers.