USER STORY
Empowering the Masses: How One Map Changed the Game for Customers and Employees
"See a need, fill a need"—the catchphrase of the animated movie Robots comes to mind when thinking about White House Utility District's (WHUD) newly launched Availability Map and customized dashboards, particularly how they all came to be.
Through the early parts of 2018, WHUD's Engineering team members were feeling a good bit of frustration around the huge communication barrier that existed between them, Customer Service, developers, external engineers, and WHUD customers when it came to availability requests. The process was built entirely around paper copies of plats and paper applications. Nothing was digitized. Nothing was easy to access. And almost everyone was left frustrated by the huge lag times and the inability to quickly access the information needed.
That's when an idea hit: Could the district use GIS and Survey123 for ArcGIS to revamp the entire availability process?
Breaking down the communication barrier
The answer was yes, and a team of three—Carl Alexander, GIS director, and Ashlyn Freeman and Shannon Murphy, both construction coordinators—got to work. After several months of intense data cleanup, survey creation, and building a first-of-its-kind Availability Map and dashboards, WHUD flipped the switch on the comprehensive, GIS-centric process and completely revolutionized the way it manages availability requests. Specifically, it has created a mechanism for quickly sharing information between departments and customers and made everyone's job much easier.
But the real power in this redesign is the degree of ingenuity and high-level of collaboration that transpired—Freeman's innate ability to problem solve and find creative solutions, Murphy's explicit attention to detail and deep understanding of the needs of all parties, the technical savvy of Alexander, and the power of GIS came together in perfect unison to solve a problem that had been plaguing the district for years.

A growing idea
While the mechanism was under development, a team of WHUD employees, including the three masterminds behind this project, attended the Esri User Conference. There, Freeman, who was less than a year into her tenure at WHUD, attended a session that showcased an application that pairs Microsoft Office with ArcGIS. Since all the district's plats and easements were documented in an Excel file, Freeman began to wonder if they could import that list straight into ArcGIS and create a map—a living, breathing, digital file. The idea was met with encouragement, and their original plan to use GIS to aid in availability requests quickly grew. Not only would they use the survey tool to capture information and create an interactive map, but they would also use this opportunity to upload older documents and files to the map, essentially creating a geospatial data warehouse for WHUD's Engineering team.
How it works
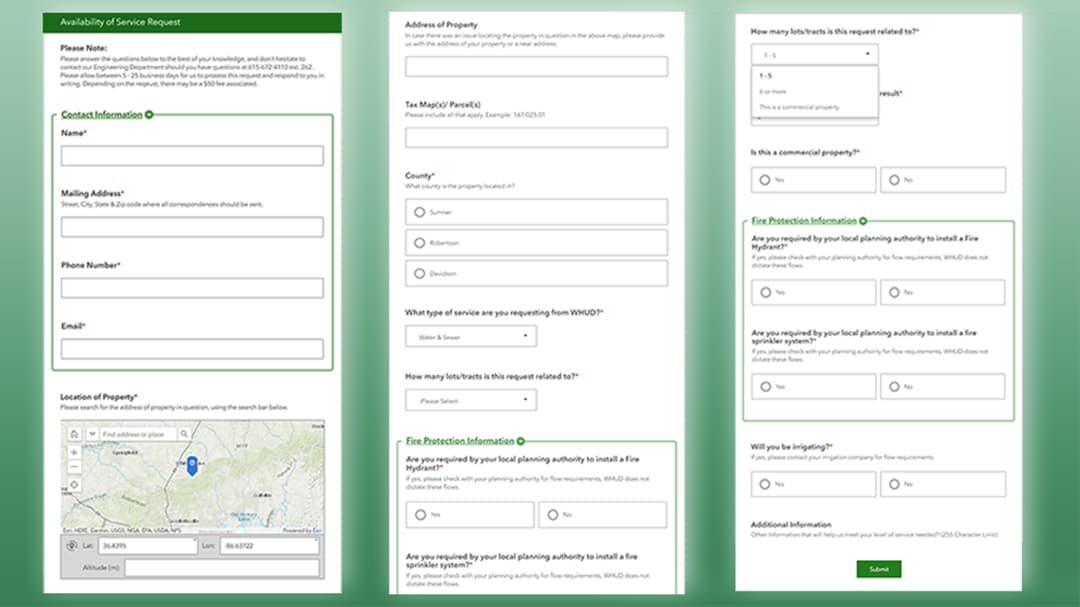
The process starts with an intuitive, logic-based questionnaire in Survey123. This single survey works for everyone, whether it's an individual planning to subdivide a single lot or a developer looking to build a large subdivision. The question tree is logic based, and different answers prompt different questions—anything and everything the Engineering team might need to process the request.

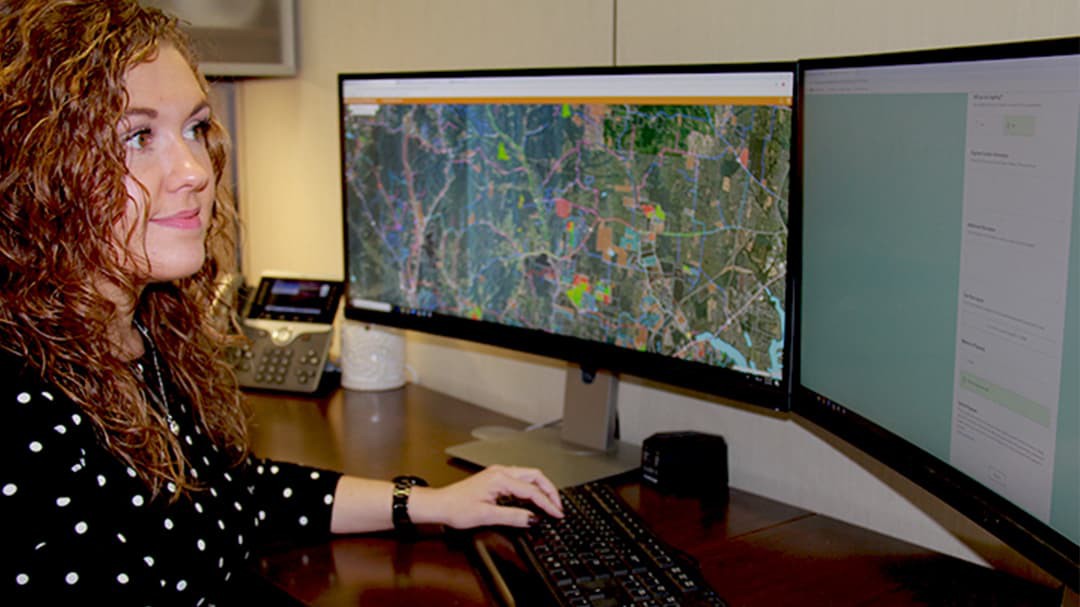
Once the survey is submitted, a new feature is created on the Availability Map, and an automated alert is sent to the Engineering team, as well as to the customer. This information feeds into the Availability Dashboard—Engineering team's one-stop shop for managing all availability requests. Through the dashboard, the Engineering team can
- Upload any related documents, like approval letters and documentation of fees paid.
- Quickly look up any request to check or change the status.
- Pull up other requests for reference.
- See the "big picture" in terms of new development.
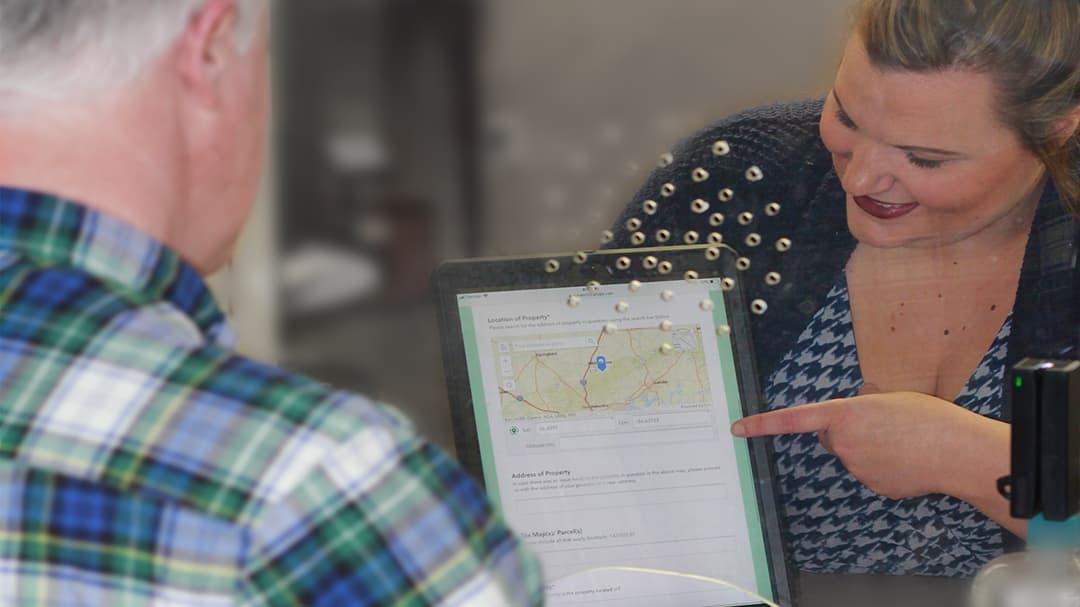
But the team didn't stop there. It also created a separate Customer Service Dashboard, published in Cityworks, that allows WHUD's customer care representatives (CCRs) to navigate to any location within WHUD's service area, click on the particular request, and get an instantaneous status update. When a customer calls, the CCR can tell if any fees are owed or if the request has been processed. If a customer comes in to complete a request, the CCRs can walk the customer through the application process using an iPad, starting with pulling up the exact location to confirm that it is correct. Prior to the creation of the availability survey, map, and dashboard, CCRs would give the customer a paper application or point them to the Engineering team for more information about the request. Understandably, the antiquated process was cumbersome and often led to disgruntled customers.
Reaping the rewards
A little more than two months since its launch, more than 65 new availability requests have been submitted, and both the Engineering team and Customer Service are reaping the benefits. The Engineering team feels much more organized. Team members are able to work faster and in a more coordinated manner. Gone are the days of digging through massive paper folders. Now, all the documentation pertaining to availability is housed in a central, online location and includes spatial data. They have significantly improved lines of communication with all parties involved. And they have already identified a number of other opportunities to scale this new process—hydrant requests, flow testing, etc.
Customer Service has felt similar benefits, from having instantaneous access to information when pressed by customers to being able to see if fees are needed or taps are ready for sale in major developments.
"We had this idea and new it would help us all work smarter and faster, and it has," said Freeman. "The Availability Map and dashboards have completely changed the game when it comes to how we process requests and support our customers. We're already looking for more opportunities to take this new application of GIS to scale."
